INTRODUCTION
Introduction
Indoor activity parks are becoming one of the most important family entertainment formats in the world. They are no longer simple playrooms, trampoline halls, or birthday party venues. The best activity parks today combine physical play, social interaction, digital experiences, food, events, parties, memberships, education, and community life into one powerful business model. They give children a place to move, explore, challenge themselves, and build confidence. They give parents a safe, reliable, and meaningful destination where family time becomes easier, healthier, and more memorable.
This book was written for owners, operators, investors, franchisees, developers, landlords, and entrepreneurs who want to understand how to build a successful and profitable activity park. It is also written for those who already operate parks and want to improve performance, modernize their concept, expand to new locations, or prepare for franchising and long-term growth. The goal is practical: to help readers make better decisions before, during, and after opening a park.
Building an activity park is exciting, but it is also complex. A successful park requires much more than buying equipment and renting a large space. It requires a clear concept, the right location, a strong activity mix, safe and efficient zoning, accurate financial planning, professional operations, effective marketing, and a long-term strategy for customer loyalty. Mistakes made at the early stages can become very expensive later. A poor location, weak layout, wrong equipment selection, or unrealistic pricing model can limit the business for years.
At the same time, the opportunity is significant. Families are looking for places where children can be active, social, and engaged away from passive screen time. Shopping centers and mixed-use developments are looking for entertainment anchors that bring traffic and keep families on-site longer. Parents are willing to pay for experiences that feel safe, valuable, convenient, and beneficial for their children. Communities need modern indoor spaces that support play, birthdays, camps, events, and social connection throughout the year.
The strongest parks understand that they serve two audiences at the same time. Children want fun, excitement, novelty, challenge, and friendship. Parents want safety, cleanliness, convenience, value, and confidence that the experience is good for their child. A park succeeds when both sides are satisfied. If children love the park but parents do not trust it, the family will not return often. If parents approve of the park but children find it boring, demand disappears. The best parks create emotional loyalty from children and rational approval from parents.
This book begins with the foundations of child development and family decision-making because every business decision should start there. Activity parks are not only entertainment venues. When designed well, they support physical development, confidence, social skills, problem-solving, emotional regulation, and family connection. Understanding why play matters helps operators design better experiences, communicate stronger value, and build brands that parents respect.
The book then moves into the industry landscape, explaining the differences between family entertainment centers, indoor playgrounds, trampoline parks, edutainment centers, branded attractions, and hybrid activity parks. It examines how the industry has evolved, which formats are growing, and what trends are reshaping the market, including AI, interactive attractions, gamification, membership systems, wellness positioning, and multi-generational design.
The strategic planning chapters focus on market analysis, location strategy, and concept development. These are among the most important decisions in the entire process. Before signing a lease or ordering equipment, operators must understand their target customers, local demographics, competition, traffic patterns, household income, family behavior, and the specific gap their park will fill. A strong concept is not a random collection of attractions. It is a focused, differentiated offer designed for a clear market.
The design chapters explain how to turn strategy into a physical experience. Zoning, flow, queues, parent visibility, safety buffers, seating, restrooms, food areas, birthday rooms, and staff sightlines all shape the success of the park. A good layout increases revenue, improves safety, reduces labor pressure, and makes the experience feel easier for families. A poor layout creates bottlenecks, anxiety, confusion, and operational problems even when the equipment itself is attractive.
The financial chapters address revenue architecture, pricing, investment, and unit economics. Activity parks depend on multiple revenue streams: admission, memberships, birthday parties, food and beverage, events, camps, private rentals, merchandise, sponsorships, and sometimes education or training programs. Understanding how these streams work together is essential for profitability. The goal is not only to attract visitors but to build a repeatable, scalable, and financially disciplined model.
The construction and launch chapters guide readers through site selection, lease negotiations, equipment procurement, permitting, construction, staffing, and pre-opening marketing. These steps require careful coordination, realistic timelines, and professional management. Opening day should not be treated as the beginning of the business. It should be the result of months of preparation, testing, training, marketing, and operational planning.
The operations chapters focus on daily management, safety, compliance, food, parties, events, and performance measurement. Great parks are not built only once; they are rebuilt every day through cleaning, staffing, guest service, maintenance, programming, and continuous improvement. Operators must know what to measure, how to interpret results, and how to make data-driven decisions that improve revenue, customer satisfaction, and retention.
The final chapters focus on marketing, loyalty, pricing optimization, scaling, franchising, and exit strategies. A profitable park is not only a local attraction. It can become a brand, a platform, a franchise system, or a portfolio of locations. Long-term value depends on the ability to build repeat visitation, strong customer relationships, operational systems, brand recognition, and financial performance that can be replicated.
This book is not intended to make activity park development look easy. It is intended to make it clearer, more structured, and more realistic. The industry has great potential, but success belongs to operators who combine imagination with discipline. Creativity matters, but so do numbers. Beautiful design matters, but so does throughput. Exciting attractions matter, but so do safety, staffing, cleaning, and pricing. A strong concept must be supported by strong execution.
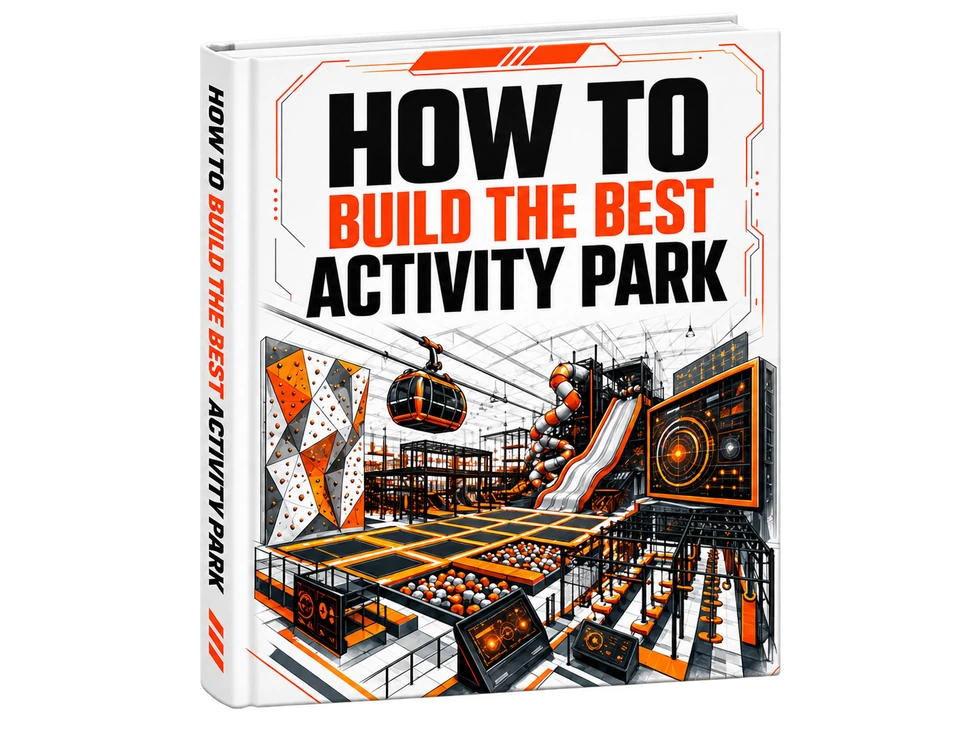
How to Build the Best Activity Park is a practical guide for turning a vision into a real business. It brings together child development, market analysis, design thinking, financial planning, operations, marketing, and growth strategy. Whether you are building your first park, improving an existing one, investing in the sector, or planning a future franchise network, this book provides the frameworks and practical guidance needed to make better decisions.
The best activity parks are more than places to play. They are places where children grow, families connect, communities gather, and businesses create lasting value.
Part I lays the developmental foundation that every successful activity park is built on. It explains how children actually learn through play, why active physical experience is irreplaceable, and how the psychology of families drives the decision to visit and return. Readers will come away with a clear understanding of the science behind play-based learning and the dual-loyalty dynamic between parents and children. This grounding matters because every design, pricing, and marketing choice later in the book traces back to these first principles.
Play is not entertainment. Play is not a break from learning. Play is learning in its most powerful and natural form. Decades of research have established that play is the primary mechanism through which children construct their understanding of the world, develop cognitive abilities, and build the social and emotional competencies that shape their future success. This is not theory or opinion. This is established developmental science with profound implications for anyone building, operating, or investing in children's activity parks.
Understanding how children learn through play is foundational to creating facilities that deliver genuine value rather than superficial entertainment. The success of an activity park rests on a simple truth: children develop through active engagement with their environment, and the quality of that environment directly shapes the quality of their development. Parks that understand this principle can position themselves not as discretionary entertainment venues but as essential developmental infrastructure that families need and value. This chapter examines the science of play through the lens of cognitive development, explores the benefits of physical activity for brain function, contrasts active play with screen-based alternatives, and explains why both structured and unstructured experiences matter.
Piaget's Framework: How Children Construct Knowledge Through Play
Swiss psychologist Jean Piaget revolutionized how we understand childhood development by demonstrating that children are not passive recipients of information waiting to be taught. They are active constructors of knowledge—little scientists who explore, experiment, and build increasingly sophisticated mental models of how the world works. Central to Piaget's framework is the recognition that play is not peripheral to cognitive development but the engine that drives it forward. This insight transforms how we should think about activity parks: they are not simply places where children burn energy, but environments where fundamental cognitive development happens.
Piaget described development as unfolding through four distinct stages, each characterized by qualitatively different ways of thinking. At each stage, play takes specific forms and serves specific developmental functions. Understanding these stages allows park designers and operators to create environments that are not merely entertaining but developmentally appropriate and genuinely beneficial. The equipment you select, the zones you create, and the experiences you design should align with how children actually think and learn at different ages. In practical terms, this means that every activity zone can be designed as a developmental challenge: a place where children test ideas, solve problems, adjust their actions, and gradually build confidence through direct experience.
The Mechanisms: Schemas, Assimilation, and Accommodation
Before examining the stages themselves, it is essential to understand the mechanisms that drive cognitive growth. Piaget proposed that children organize their knowledge and experiences into schemas—mental and physical frameworks that represent concepts, actions, or categories. A young infant develops a grasping schema and a sucking schema. An older child develops schemas for dog, fairness, or multiplication. These schemas are not static; children constantly refine them through interaction with the world.
Children refine schemas through two complementary processes. Assimilation occurs when new information fits comfortably into an existing schema—when a child sees a new breed of dog and correctly identifies it as a dog. Accommodation occurs when new information does not fit, forcing the child to modify or create new schemas—when the child encounters a cat for the first time and must learn that not all four-legged furry animals are dogs. These processes are driven by equilibration, an internal mechanism that propels children toward cognitive balance. When children encounter something that does not match their existing understanding, they experience cognitive tension that motivates them to restore balance by adjusting their schemas. This cycle is what moves children forward through developmental stages.
Stage 1: The Sensorimotor Stage (Birth to 2 Years)
In the first two years of life, infants learn about the world entirely through their senses and physical actions. They cannot yet think symbolically or use language to represent objects internally. Instead, learning is experiential: grasping, shaking, dropping, watching, listening, tasting. Everything is direct physical engagement. The defining achievement of this stage is the development of object permanence—the understanding that objects continue to exist even when they cannot be seen or touched. Before approximately eight months of age, an infant will lose interest in a toy once it is hidden, as if the object has ceased to exist. After object permanence emerges, the infant will actively search for the hidden object, demonstrating an internal mental representation.
Play during the sensorimotor stage is fundamentally physical and exploratory. Repetitive actions—dropping a spoon from a highchair over and over, or repeatedly opening and closing a cabinet door—are not mindless behavior but sophisticated experiments in cause and effect. Games like peek-a-boo directly support the development of object permanence and become endlessly delightful precisely because they align with the child's emerging cognitive capacity. Toward the end of this stage, the first hints of symbolic thought appear when a child uses one object to represent another—perhaps using a block as a telephone. For park operators, this means that toddler zones must prioritize sensory richness, physical manipulation, and opportunities for safe exploration rather than complex rules or abstract concepts.
Stage 2: The Preoperational Stage (2 to 7 Years)
Between ages two and seven, children undergo a cognitive revolution: the emergence of symbolic thought. They can now use words, images, and objects to represent things that are not physically present. This capability opens up a rich imaginative world, but their thinking remains limited in important ways. They are egocentric, struggling to understand that others may have different perspectives. They exhibit centration, focusing on one salient feature of a problem while ignoring others. They often demonstrate animism, attributing feelings and intentions to inanimate objects. These are not deficits to be corrected but natural characteristics of this developmental stage.
Play in the preoperational stage is dominated by pretend play and symbolic play. A cardboard box becomes a spaceship; a stick becomes a sword; a playmate becomes a doctor or a monster. Through these imaginative scenarios, children practice language, explore social roles, and experiment with abstract concepts in a safe, low-stakes environment. The importance of this type of play cannot be overstated. It is the primary vehicle through which children develop metacognition—the ability to think about thinking—and begin to overcome their natural egocentrism by taking on different perspectives. For park designers, this means creating spaces and props that support imaginative role-play, not just physical challenges. Zones that can be transformed by children's imagination serve critical developmental functions during this stage.
Stage 3: The Concrete Operational Stage (7 to 11 Years)
Around age seven, children's thinking becomes significantly more logical and organized, though it remains tied to concrete, tangible experiences. They can now perform mental operations—reversible mental actions—on concrete objects and events. Key achievements include understanding conservation (that quantity remains the same despite changes in appearance), reversibility (mentally reversing an action to return to the starting point), and the ability to classify and order objects systematically. They can think logically about cause and effect, understand multiple perspectives simultaneously, and apply systematic reasoning to problems they can see and touch.
Play during this stage becomes more rule-based and logical. Children are drawn to games with clear rules, structured challenges, and opportunities to test hypotheses. Hands-on activities—building complex structures, conducting simple experiments, engaging in strategic games—are particularly valuable. Physical play on equipment like swings, climbing structures, and balance beams allows children to explore concepts like gravity, momentum, and spatial relationships in tangible, embodied ways. This is the age group that thrives on obstacle courses, challenge zones, and progressive skill-building activities. Parks that serve this age range should offer clear progression paths, mastery challenges, and opportunities to test growing physical and cognitive capabilities against meaningful standards.
Stage 4: The Formal Operational Stage (11 Years and Beyond)
Beginning around age eleven, adolescents develop the capacity for abstract thought, hypothetical reasoning, and systematic problem-solving. They can think about what-if scenarios, engage in deductive logic, and consider multiple variables simultaneously. This is the age of scientific thinking, philosophical questioning, and strategic planning. They no longer need concrete objects to reason logically; they can manipulate ideas and concepts entirely in their minds.
While physical manipulation of objects becomes less central to learning, play continues to serve important developmental functions. Strategic games, debates, design challenges, and scientific investigations all provide opportunities to exercise advanced reasoning skills. For park operators, this means that retaining the engagement of older children and teenagers requires offering intellectually stimulating challenges—complex escape room puzzles, competitive team-based games, opportunities for creative expression, and experiences that allow them to test themselves against meaningful standards. Simple physical activities are no longer sufficient; the challenges must engage their developing capacity for abstract strategic thinking.
The Cognitive and Social-Emotional Benefits of Physical Play
Physical play is far more than a way to burn off energy or keep children occupied. It is a powerful catalyst for brain development, particularly in the domain of executive functions—the higher-order cognitive processes that enable goal-directed behavior, self-regulation, and adaptive thinking. Executive functions are among the strongest predictors of academic success, career achievement, and overall life outcomes. Children who develop strong executive functions early in life demonstrate better academic performance, healthier social relationships, and greater emotional resilience throughout childhood and into adulthood.
Executive functions encompass three core capacities: inhibitory control (the ability to resist impulses and maintain focus), working memory (holding and manipulating information in mind), and cognitive flexibility (switching between tasks or perspectives). Physical play provides a natural training ground for all three. Games that require children to follow rules—like Simon Says or freeze tag—directly train inhibitory control by requiring children to suppress automatic responses. Studies have shown that moderate to vigorous physical activity, particularly in social settings, significantly improves inhibitory control in preschool-aged children. Activities that involve remembering sequences, patterns, or multi-step instructions strengthen working memory. And the dynamic, unpredictable nature of social play—where children must constantly adapt to changing scenarios, negotiate with peers, and switch between roles—enhances cognitive flexibility.
Research on programs that integrate physical activity with learning tasks has demonstrated measurable improvements in children's attention scores and school readiness. The mechanism is straightforward: physical activity increases blood flow to the brain, stimulates the release of neurotransmitters that support learning and memory, and provides embodied experiences that make abstract concepts concrete. When children physically experience concepts like balance, momentum, spatial relationships, and cause-and-effect through active play, they develop deeper and more durable understanding than passive instruction alone can provide. For park operators, this research provides powerful justification for positioning activity parks as developmental investments rather than entertainment expenses.
Fostering Social and Emotional Competence
The benefits of physical play extend far beyond cognition into the critical domains of social and emotional development. When children play together, they engage in sophisticated social learning that cannot be replicated through instruction alone. Language development flourishes during play because children must communicate to coordinate their actions. They negotiate rules, explain their ideas, resolve conflicts, and co-create imaginary scenarios—all of which require and thereby strengthen language skills. Studies have found that providing preschool children with simple toys like blocks and allowing them to engage in minimally directed play leads to significant gains in language acquisition, with particularly strong effects for children from low-income backgrounds.
Emotional regulation—the ability to manage emotions in adaptive ways—is another critical outcome of active play. During unstructured play, children encounter frustration when a game does not go their way, disappointment when a friend chooses someone else, and excitement when they succeed. These experiences, navigated without constant adult intervention, teach children to modulate their emotional responses and develop resilience. They learn that setbacks are temporary, that emotions can be managed, and that they have agency in social situations. This type of emotional learning cannot be taught through direct instruction; it must be experienced in authentic contexts.
At the neurological level, active play supports healthy brain development in ways that passive activities cannot. Animal studies suggest that play-rich environments promote the development of the prefrontal cortex, the brain region responsible for emotional control and prosocial behavior. In human infants and toddlers, active social play has been linked to lower levels of cortisol, the stress hormone. Since chronically elevated cortisol can impair brain development, play may serve a protective function, buffering children against the negative effects of stress. This is particularly important in environments like childcare centers or during periods of family stress, where opportunities for active, joyful play can provide essential developmental protection.
Active Play vs. Sedentary Screen Time: A Developmental Trade-Off
One of the most significant challenges facing modern childhood is the displacement of active play by passive screen time. While digital technology offers certain educational opportunities, the developmental costs of excessive, passive screen use are well-documented and increasingly concerning to health authorities worldwide. Understanding this trade-off is essential for positioning activity parks as solutions to a pressing developmental challenge rather than optional entertainment.
Active play is a holistic developmental activity that simultaneously engages a child's body, mind, and emotions. Cognitively, it fosters problem-solving, creativity, and sustained attention. Socially and emotionally, it builds empathy, cooperation, and emotional resilience through peer interaction. Physically, it develops gross and fine motor skills, cardiovascular fitness, and body awareness. Unstructured active play—child-led exploration without predetermined outcomes—offers unique benefits: it allows children to build resilience by managing their own challenges, develops creativity by requiring them to invent their own games, and fosters independence by placing them in charge of their own experience.
Passive screen time—activities like watching videos or scrolling through content that require minimal interaction and little physical movement—presents developmental risks primarily through displacement. Time spent on screens is time not spent in active play, face-to-face social interaction, hands-on exploration, or sleep—all of which are critical for healthy development. Studies have linked excessive passive screen use to attention difficulties, delayed language development, and reduced problem-solving skills, likely because these activities provide limited opportunities for the kind of active engagement that drives cognitive growth. Additionally, the highly stimulating and instantly gratifying nature of much screen content can make it harder for children to regulate their emotions, tolerate boredom, and sustain attention on less immediately rewarding tasks. The concern is not that screens are inherently damaging in small doses, but that they can crowd out more developmentally productive activities.
Official Guidelines: Protecting Time for Play
Recognizing these risks, leading health organizations have established clear guidelines limiting screen time and promoting physical activity. The World Health Organization recommends no screen time for infants under one year of age. For one-year-olds, sedentary screen time is not recommended; for two-year-olds, it should be limited to no more than one hour per day, with less being better. For children aged three to four, sedentary screen time should not exceed one hour per day. The WHO emphasizes that this time should be replaced with active play and that quality sedentary time should involve interactive, non-screen activities like being read to by a caregiver.
The American Academy of Pediatrics recommends that toddlers aged one to four have at least 60 minutes of unstructured physical activity daily, with three- to five-year-olds needing at least three hours of total physical activity per day. For children and adolescents aged six to twenty-one, the AAP recommends at least 60 minutes of moderate to vigorous physical activity on most days of the week, including muscle- and bone-strengthening activities at least three days per week. The AAP also advises avoiding screen time for children under 18 months (except for video-chatting) and limiting use to one hour of high-quality, co-viewed programming for children aged two to five.
While some active screen time—such as educational apps or video calls—can offer limited benefits, it should not be considered a substitute for real-world, physical play. The developmental imperative is clear: protect and prioritize time for hands-on, active exploration of the physical and social world. For activity park operators, these guidelines provide powerful third-party validation for marketing positioning. Parents are not just buying entertainment; they are providing their children with the kind of active, screen-free experiences that major health organizations explicitly recommend as essential for healthy development.
Structured vs. Unstructured Play: A Necessary Balance
Not all play is created equal, and an effective developmental environment must provide both structured play (adult-guided, goal-oriented activities) and unstructured play (child-led, open-ended exploration). Each serves distinct but complementary developmental functions, and the most successful activity parks intentionally provide both rather than forcing families to choose.
Structured play involves specific rules, objectives, and adult guidance. Examples include organized sports, board games with established rules, dance or music classes, and guided building projects. Structured play is highly effective for teaching specific skills—whether cognitive (pattern recognition, numeracy), physical (coordination, technique), or social (turn-taking, teamwork). It teaches children to follow instructions, work toward predetermined goals, and develop discipline and focus. In group settings, structured play provides a clear framework for learning cooperation and communication. Successfully completing a structured task builds confidence and provides a sense of accomplishment. For park operators, structured play might include scheduled classes, guided challenges with specific learning objectives, organized tournaments, or staff-led activities with clear rules and outcomes.
Unstructured play is child-led, spontaneous, and open-ended. The child determines the content, the rules (if any), and the duration. Examples include free building with blocks, imaginative role-play, exploring in nature, or creating art without a predetermined outcome. This form of play is the engine of creativity. It allows children to invent their own worlds, experiment with ideas, and develop flexible, innovative thinking. Because children are in charge, unstructured play fosters independence, decision-making, and self-reliance. It provides an essential outlet for processing emotions, reducing anxiety, and simply relaxing without performance pressure. Research suggests that unstructured play can significantly reduce anxiety levels in children.
In peer settings, unstructured play requires children to negotiate roles, share resources, and resolve conflicts without immediate adult intervention—building sophisticated social problem-solving skills that serve them throughout life. For park operators, this means creating open zones where children can explore, invent their own games, and interact with equipment in ways that were not necessarily intended by the designers. It means resisting the urge to over-program every minute and trusting that children will create valuable experiences when given the space and tools to do so.
A well-designed activity park does not force a choice between structured and unstructured play; it intentionally provides both. This might mean offering scheduled classes and challenges alongside open play zones, or creating equipment that can be used in prescribed ways (structured) or explored freely (unstructured). It can involve providing a mix of toys and materials—some with clear purposes (puzzles, games with rules) and others that invite open-ended creativity (building materials, art supplies). The balance between the two types of play allows children to develop a comprehensive skill set: the discipline and cooperation that come from structured activities combined with the creativity and independence that emerge from unstructured exploration. Both are essential. Both belong in a high-quality activity park.
Conclusion
The evidence is unequivocal: play is not a luxury or a distraction from learning. It is the primary vehicle through which children build cognitive structures, develop executive functions, acquire social competencies, regulate emotions, and construct their understanding of the world. This is not speculation or marketing language. This is established developmental science with direct implications for how activity parks should be conceived, designed, and operated.
For park owners, operators, and franchisees, this research establishes a critical foundation. An activity park is not just a place for children to have fun. When designed with an understanding of developmental science, it becomes an environment where cognitive growth, social learning, emotional resilience, and physical development happen naturally and joyfully. The child who climbs, negotiates with peers, experiments with balance, creates imaginary scenarios, and experiences both success and manageable failure is not merely playing—they are learning in the most powerful way humans know how.
Understanding Piaget's stages helps create age-appropriate zones and challenges. Recognizing the benefits of physical play for executive functions and emotional regulation helps justify value propositions to parents. Understanding the risks of excessive screen time and the protective power of active play helps position parks as essential developmental resources, not discretionary entertainment options. And recognizing the complementary benefits of structured and unstructured play helps design balanced environments that serve the full spectrum of developmental needs.
When you build a park grounded in this understanding, you are not just building a business. You are building developmental infrastructure that serves children, supports families, and addresses one of the most pressing challenges of modern childhood: creating space and time for the kind of play that makes healthy development possible. That is a value proposition that resonates with parents, justifies premium pricing, and creates sustainable competitive advantage in a growing market.
Summary Points
✓Play is the primary mechanism of learning in childhood, not a break from it.
✓Established developmental research confirms that play drives cognitive, social, emotional, and physical development.
✓Piaget's stages of cognitive development show how play evolves from sensorimotor exploration (birth to 2 years) through symbolic pretend play (2 to 7 years).
✓Understanding these stages allows parks to create developmentally appropriate experiences for different age groups.
✓Physical play strengthens executive functions, including inhibitory control, working memory, and cognitive flexibility, which are among the strongest predictors of academic and life success.
✓This provides scientific justification for positioning activity parks as developmental investments.
The landscape of childhood has changed dramatically over the past generation. Children today face environmental barriers, social constraints, and lifestyle patterns that previous generations did not encounter—or at least not to the same degree. Outdoor play, once the default mode of childhood recreation, is becoming less accessible, less safe, and less reliable due to factors ranging from extreme weather to urban design to parental safety concerns. At the same time, understanding of what children need for healthy development has deepened considerably, raising expectations for the quality and purpose of recreational environments.
In this context, indoor activity parks have emerged not as a novel luxury but as a necessary response to modern challenges. They represent a purpose-built solution to a set of intersecting problems: unreliable weather and climate extremes, diminishing access to safe outdoor spaces, increased demand for structured developmental experiences, and families' need for reliable, convenient environments where both children and parents can have their needs met simultaneously. Understanding what indoor activity parks uniquely provide clarifies why the market for family entertainment centers is experiencing rapid growth and why these facilities are increasingly viewed as essential infrastructure rather than discretionary entertainment.
This chapter examines the distinct value proposition of indoor activity parks: climate-resilient spaces for year-round physical activity, environments designed to support holistic child development, opportunities for essential social interaction, and much-needed third spaces where families can connect, relax, and build community. For investors, operators, and developers, understanding these value dimensions is essential to positioning, marketing, and operational decision-making.
A Climate-Resilient Solution for Year-Round Physical Activity
Regular physical activity is foundational to children's health and development. It reduces the risk of obesity and chronic disease, supports cognitive function and emotional regulation, and builds the motor skills and physical confidence that enable lifelong participation in active pursuits. Yet only a small fraction of children in the United States currently meet recommended physical activity guidelines. Historically, outdoor play was the primary means of ensuring children remained active. That paradigm is now under significant and accelerating pressure from climate-related factors that make outdoor play increasingly unreliable, uncomfortable, and in some cases dangerous. This makes indoor activity parks increasingly important as controlled, safe, and weather-resilient environments where children can move, play, and develop throughout the year.
The Growing Unreliability of Outdoor Play
Climate change is not a distant, abstract threat to childhood development. It is a present-day reality that directly affects where, when, and whether children can play outside. Extreme heat is among the most pressing concerns. Rising global temperatures and more frequent, prolonged heatwaves have made outdoor play unsafe during significant portions of the year in many regions. Playground surfaces—asphalt, rubber matting, and metal equipment—can reach dangerously high temperatures, creating risks for thermal burns, dehydration, and heat-related illnesses. Research shows that children's engagement in moderate to vigorous physical activity declines sharply during hot weather, leading to increased sedentary time precisely when activity is most needed. In cities like Baton Rouge, Louisiana, which experienced 140 days above 90 degrees Fahrenheit in 2023, outdoor activities and school recess are frequently canceled—a trend projected to worsen.
Poor air quality from increasing wildfire activity adds another layer of risk. Smoke and particulate matter make it unsafe for children to engage in vigorous outdoor activity for extended periods, effectively shutting down outdoor play during fire season in large parts of the western United States and beyond. Flooding and severe storms render playgrounds unusable, damage equipment, and can deposit toxic sediments containing heavy metals that pose serious risks to children's developing nervous systems. The increasing frequency and intensity of these events mean that outdoor play spaces face more downtime and require more frequent maintenance and remediation.
Beyond climate factors, many communities—particularly those with lower socioeconomic status—lack access to safe, well-maintained outdoor play spaces. Schoolyards are often outdated and lack features like shade structures or heat-resistant materials that could mitigate climate impacts. Financial constraints mean that outdoor recreation areas are often a low priority for renovation, creating a compounding effect where the communities most vulnerable to climate impacts have the least access to resilient play infrastructure. For families in these communities, indoor activity parks may represent the only reliable access to high-quality active play environments.
Indoor Parks as Climate-Resilient Infrastructure
Indoor activity parks directly address these challenges by providing a controlled, climate-resilient environment where physical activity can occur reliably regardless of external conditions. They eliminate the unpredictability of weather as a barrier to play. Whether it is 105 degrees outside, raining, snowing, or experiencing hazardous air quality, the indoor environment remains consistent, comfortable, and safe. This reliability is not a minor convenience—it is a fundamental shift in access to physical activity for many families.
Families can plan visits without checking the weather forecast. Schools and camps can schedule field trips with confidence. Children can develop consistent activity habits because the environment is dependably available. Parents can maintain weekly routines without weather-related cancellations disrupting schedules and disappointing children. This predictability has real value that families recognize and are willing to pay for, particularly in regions with extreme or unpredictable weather patterns.
For park operators and investors, this climate resilience translates into operational stability and financial predictability. While outdoor venues face seasonal fluctuations and weather-related cancellations that create revenue volatility, indoor parks operate year-round with predictable conditions. This stability supports more reliable financial projections, more consistent staffing, and the ability to build long-term customer relationships based on routine visitation patterns rather than opportunistic visits during good weather. In financial models, this reduced volatility lowers risk and increases the attractiveness of indoor concepts compared to weather-dependent alternatives.
Fostering Holistic Child Development
Indoor activity parks are not simply enclosed playgrounds. When designed with developmental principles in mind, they become dynamic environments that simultaneously support cognitive, social, emotional, and physical growth. They accomplish this by blending the benefits of unstructured play with the intentional design of age-appropriate physical challenges and social infrastructure. The result is an environment that delivers more developmental value per square foot than most alternatives available to families.
The Power of Play: Blending Structure and Freedom
As discussed in Chapter 1, child development experts distinguish between structured play (adult-guided, goal-oriented) and unstructured play (child-led, spontaneous, open-ended). Each type serves distinct developmental functions, and the most effective developmental environments provide both. Indoor activity parks excel at providing a hybrid environment that captures the benefits of each approach.
The physical space itself is structured—designed by professionals with safety standards, age-appropriate challenges, and intentional developmental goals. The equipment is selected and arranged deliberately. Safety protocols are in place. Yet within this structured framework, children are free to engage in unstructured play. They can explore a foam pit in their own way, invent games on trampolines, create their own routes through climbing structures, or collaborate with peers on spontaneous challenges. The structure provides safety and developmental optimization; the freedom provides creativity and autonomy.
This combination allows children to experience the creative and social benefits of self-directed play within a safe, stimulating environment that has been optimized for developmental outcomes. It is the best of both worlds: the freedom of unstructured exploration supported by the intentionality of expert design. For parents, this hybrid model provides reassurance (the environment is professionally designed and safe) while allowing children the autonomy they crave. For operators, it means the facility can serve developmental functions without requiring constant staff-led programming, allowing for efficient operation while maintaining high value delivery.
Enhancing Social and Motor Skills
Peer interaction is the primary mechanism through which children develop social competence. Through play with other children, they learn empathy, perspective-taking, turn-taking, cooperation, negotiation, and conflict resolution. These skills cannot be taught through direct instruction alone; they must be practiced in authentic social contexts where real relationships and real conflicts emerge and must be navigated. Indoor activity parks naturally function as social hubs, bringing children together in a less formal setting than school but within a contained, supervised environment where social learning can occur safely.
The shared physical challenges create natural opportunities for collaboration, friendly competition, and mutual encouragement. Children who might not meet in other contexts find common ground through play, building friendships and social confidence. The repeated encounters that occur when families visit regularly allow deeper relationships to form, creating social bonds that increase both child and parent loyalty to the facility. For many families, particularly those new to an area or seeking to expand their social circles, activity parks provide essential social infrastructure that would otherwise be difficult to access.
Simultaneously, these environments are specifically designed to promote motor skill development through age-appropriate physical challenges. The equipment and activity zones cater to a wide developmental range. Toddlers (ages one to three) benefit from soft-play areas with low-to-the-ground structures, padded climbers, gentle slides, and sensory elements that allow safe practice of fundamental motor skills—crawling, climbing, walking on varied surfaces—all critical for building balance, coordination, and body awareness. Preschoolers (ages three to five) engage with a broader array of climbers, slides, spinners, and interactive elements that refine gross motor skills, improve strength and agility, and encourage vigorous physical activity essential for overall health and fitness.
School-aged children (ages five to twelve) are challenged by more complex structures—high rope climbers, overhead ladders, trampoline zones, obstacle courses, and climbing walls—that build upper-body and core strength, enhance cardiovascular fitness, and improve balance and coordination. Mastering these difficult tasks also boosts problem-solving abilities and self-esteem. By providing developmentally appropriate physical challenges across age groups, indoor activity parks ensure that children are not just moving, but engaging in movement that builds physical literacy, confidence, and competence. This developmental progression creates opportunities for children to see themselves advancing over time, which reinforces loyalty and encourages continued participation.
The Modern Third Space for Families
Sociologists use the term third space to describe environments that exist outside the home (the first space) and work or school (the second space). These are places where people gather informally, build community, and experience social connection beyond their immediate households. Historically, public squares, cafes, parks, and community centers served this function. For adolescents in suburban America, shopping malls became a default third space—a place to socialize, explore identity, and spend time with peers outside parental supervision.
However, access to these traditional third spaces is becoming more restricted. In response to concerns about unsupervised minors, some malls have implemented policies requiring parental supervision, effectively closing off what was once a primary social outlet for teenagers. Public parks, as discussed earlier, are increasingly unreliable due to climate factors. Community centers may lack the appeal or accessibility that families need. The erosion of third spaces has consequences for both children and parents, reducing opportunities for informal socialization, community building, and the kind of unstructured social time that supports well-being.
Indoor Parks as Purpose-Built Third Spaces
Indoor activity parks are uniquely positioned to fill this void. They are purpose-built destinations designed to meet the needs of both children and parents within a single, integrated environment. For children and teenagers, these parks provide a dynamic, exciting space to socialize with peers in a supervised setting. Unlike a shopping mall, the activity is the draw—not passive consumption, but active engagement. Children develop friendships through shared physical challenges, collaborative play, and repeated encounters in a familiar environment. The park becomes their place—a space associated with autonomy, fun, and social belonging.
For parents, indoor activity parks offer something equally valuable: a space where children can play safely and actively while parents experience a degree of relief from constant, direct supervision. This is not about neglecting parental responsibility—these environments are professionally monitored and designed with safety as a core principle. Rather, it is about creating conditions where parents can relax somewhat, knowing their children are in a contained, secure environment where risks are managed and supervision is provided by trained staff.
This relief has tangible benefits that parents recognize and value. Parents can socialize with other adults, catch up on work using park amenities like Wi-Fi and seating areas, read a book, or simply sit comfortably and observe their children playing without needing to intervene constantly. For many parents, particularly those of young children, opportunities for this kind of respite are rare and precious. The combination of developmental value for children and respite for parents creates a win-win dynamic that encourages repeat visitation and builds loyalty. Parents are not just paying for their children to play; they are paying for an experience that meets their own needs as well.
Community Building and Social Capital
Beyond individual family benefits, indoor activity parks can serve as genuine community hubs where families meet neighbors, build social networks, and develop the kind of social capital that strengthens communities. Birthday parties, group events, seasonal celebrations, and regular visitation create repeated encounters among families, fostering relationships that extend beyond the park itself. These connections have real value: they reduce isolation, provide social support, create informal networks of mutual aid, and contribute to the sense of belonging that makes communities resilient.
For parents, particularly those who are new to an area or seeking to expand their social circles, activity parks provide low-pressure opportunities to connect with other parents whose children are similar ages and who share similar values around active, developmental play. These relationships can reduce parental isolation, provide social support during challenging periods, and create informal networks that facilitate playdates, carpooling, childcare exchanges, and friendship. The social connections formed at activity parks often become as valuable to parents as the physical activity is to children.
For communities, activity parks that position themselves as gathering spaces—not just commercial entertainment venues—can contribute to social cohesion and become valued community assets. This positioning can generate goodwill, positive media coverage, and political support that benefits the business while serving genuine social functions. Operators who recognize and cultivate this community role can build deeper roots in their markets, create competitive moats through social embedding, and generate customer loyalty that extends beyond transactional satisfaction.
Filling the Gaps in Modern Childhood
The rise of indoor activity parks is not driven solely by climate change or the search for third spaces. It also reflects a broader recognition that many children today lack sufficient opportunities for the kind of active, unstructured, socially rich play that was once a default feature of childhood. Children's daily lives are often highly structured, with schedules dominated by school, homework, organized activities, and screen time. Time for free, exploratory play has declined significantly over recent decades. Access to safe outdoor spaces where children can roam, explore, and play independently has diminished in many communities due to safety concerns, urban design patterns that prioritize cars over pedestrians, and the loss of informal play spaces to development.
Indoor activity parks address this gap by providing intentional space for play—environments specifically designed to enable the kind of active, exploratory, socially engaging experiences that might not otherwise occur in children's lives. They offer a contained alternative to unsupervised outdoor roaming, which many parents no longer feel comfortable allowing, while avoiding the passive, sedentary nature of screen-based entertainment. They create opportunities for children to take appropriate risks, test their physical limits, collaborate with peers, and experience autonomy within safe boundaries.
In this sense, indoor activity parks are not competing with traditional outdoor play; they are compensating for its reduced availability. For many families, especially those in urban environments, extreme climates, or under-resourced communities, indoor parks may be the primary or only regular access point for high-quality active play environments. This is not a failure of parenting or a rejection of nature; it is a pragmatic response to real constraints that families face. When designed well, these parks can restore some of the movement, freedom, challenge, and peer interaction that many children have lost in everyday life. Operators who understand this context can position their facilities not as luxury entertainment but as essential services that address genuine unmet needs.
Market Validation: Robust Growth and Rising Demand
The value proposition of indoor activity parks is validated by strong and accelerating market demand. The global Family Entertainment Center market, which includes indoor activity parks, is experiencing robust growth, with market analyses projecting a compound annual growth rate between 10 percent and 13 percent over the next decade. Various reports forecast the industry's value expanding significantly, with some estimates suggesting the market could exceed 100 billion USD by 2032. These projections are based on observable trends in consumer behavior, demographic patterns, and market dynamics that show no signs of reversing.
Several key factors are driving this expansion. Demand for experiential entertainment is a major driver. Consumers, particularly millennial parents, increasingly prioritize spending on experiences over material goods. Families want interactive, engaging, memorable activities that create shared experiences and lasting memories. Indoor activity parks deliver precisely that value proposition, offering experiences that cannot be replicated at home and that become part of family identity and tradition.
Technological integration is expanding the appeal and capabilities of family entertainment centers. The adoption of interactive technologies like virtual reality, augmented reality, gamification, and digital tracking systems is creating more immersive and personalized attractions. These innovations broaden the appeal of facilities beyond young children to include older kids, teenagers, and even adults, expanding the potential customer base and increasing per-visit spending through premium offerings. Technology also enables better customer relationship management, personalized marketing, and operational efficiency, improving both customer experience and unit economics.
Urbanization continues to drive demand as more families live in urban and suburban areas with limited private outdoor space. As yard sizes shrink and apartment living becomes more common, the need for high-quality, accessible public and commercial recreation facilities grows. Indoor parks serve as a proxy for the backyard or neighborhood park that many families no longer have access to. This trend is particularly strong in major metropolitan areas where population density is high, real estate is expensive, and outdoor recreational space is limited.
The industry is also evolving to meet changing consumer expectations and create competitive differentiation. Trends include edutainment centers that blend play with learning to appeal to education-conscious parents, hybrid models that combine recreation with dining and retail to create destination experiences, and a growing emphasis on eco-friendly practices and sustainability to attract environmentally conscious consumers. These innovations demonstrate industry sophistication and responsiveness to market demands.
However, the industry does face challenges that shape competitive dynamics. High initial capital investment for state-of-the-art facilities creates barriers to entry but also necessitates careful financial planning and disciplined execution. Intense competition requires continuous innovation to retain customer interest and prevent commoditization. The need to maintain operational excellence to build trust and loyalty means that success requires not just building an attractive facility, but operating it with consistency, professionalism, and genuine attention to both child development and parent experience. Markets are maturing in some regions, requiring operators to compete on quality and differentiation rather than novelty alone.
Nuances and Balanced Perspectives
While the benefits of indoor activity parks are clear and well-supported by research, it is important to maintain a balanced perspective and acknowledge nuances in the evidence. Some research suggests that outdoor play may offer unique benefits that are difficult to replicate indoors. For example, one study found that preschool-aged children exhibited better attentional control after a period of unstructured outdoor play compared to equivalent indoor play. The natural environment may provide sensory richness, variability, and psychological benefits—such as stress reduction and attention restoration—that are inherently tied to nature exposure.
This finding does not diminish the value of indoor parks; rather, it situates them within a broader ecosystem of childhood experiences. In an ideal world, children would have ample access to both safe, stimulating natural outdoor environments and high-quality indoor facilities. The reality, however, is that consistent, safe outdoor play is not reliably available to many families due to climate, urban design, safety concerns, or resource constraints. In these circumstances, indoor activity parks serve as an essential resource, not merely a supplemental one.
The goal is not to replace outdoor play but to ensure that children have consistent opportunities for the kind of active engagement they need, regardless of external conditions. Indoor parks are best understood as complementary to outdoor play rather than competing with it. For operators, this means that messaging should acknowledge the value of outdoor experiences while positioning indoor parks as the reliable, year-round solution that ensures children can stay active regardless of weather, season, or neighborhood resources. This honest positioning builds trust with parents who value outdoor play but need practical alternatives during large portions of the year.
Conclusion
Indoor activity parks provide a comprehensive and multifaceted value proposition that addresses some of the most pressing challenges facing modern childhood. They function as climate-resilient infrastructure, offering reliable, year-round access to physical activity when outdoor options are increasingly compromised by extreme weather and environmental factors. They serve as holistic developmental environments, blending the benefits of structured and unstructured play to support cognitive, social, emotional, and motor development simultaneously. They create essential third spaces where families can connect, children can socialize, and parents can experience respite in a safe, engaging setting.
The strong and sustained growth of the Family Entertainment Center market—projected to see double-digit annual growth rates over the coming decade—validates this value proposition. Families are demonstrating through their spending patterns that they recognize indoor activity parks not as frivolous entertainment but as valuable, necessary resources that meet genuine needs. This market validation provides confidence for investors, landlords, and operators considering entry into or expansion within this sector.
For owners, operators, and franchisees, understanding what activity parks provide—and why they provide it better than available alternatives—is essential to effective positioning, marketing, and operational decision-making. These parks are not competing primarily on price or convenience, though both matter. They are competing on the depth and quality of the developmental, social, and experiential value they deliver. When that value is clearly understood, communicated effectively, and consistently delivered, indoor activity parks become not just viable businesses but essential community assets that families depend on and are willing to support financially.
The key strategic insight is that indoor activity parks occupy a unique position at the intersection of several powerful trends: climate adaptation needs, screen time concerns, experiential consumption preferences, urban density, and heightened awareness of child development. This convergence creates favorable market conditions that are likely to persist and strengthen over time. Operators who execute well within this favorable environment have the opportunity to build sustainable, profitable businesses that deliver genuine social value while achieving strong financial returns.
Summary Points
✓Indoor activity parks provide climate-resilient infrastructure for year-round physical activity, addressing the growing unreliability of outdoor play due to extreme heat, poor air quality.
✓These environments support holistic child development by blending structured design (safety, age-appropriate challenges) with opportunities for unstructured, child-led play, fostering creativity, independence, social skills.
✓Indoor parks serve as modern third spaces where families can gather, children can socialize with peers.
✓Motor skill development is optimized through age-appropriate equipment and challenges for toddlers, preschoolers, and school-aged children, building physical literacy, confidence.
✓The Family Entertainment Center market is experiencing robust growth with projections of 10 to 13 percent annual growth driven by demand for experiential entertainment.
✓While outdoor play offers unique benefits, particularly in nature exposure and attention restoration.
Understanding why families choose to visit indoor activity parks—and why they choose to return—is fundamental to building a successful, sustainable business. On the surface, the decision may appear straightforward: children want to have fun, and parents want their children to be happy. But this explanation is far too simple to guide meaningful strategic or operational decisions. It provides no insight into pricing strategy, attraction selection, marketing messaging, loyalty program design, or the dozens of other decisions that determine whether a park thrives or struggles.
The reality is that family decision-making about leisure activities is a complex, multi-layered process involving two distinct decision-makers with different motivations, different evaluation criteria, and different forms of influence. Children create demand pressure through emotional appeals, requests, and enthusiasm. Parents control spending decisions through rational evaluation of cost, safety, convenience, and developmental value. When both stakeholders' needs align, parks thrive. When they diverge, even the most well-designed facility struggles to build sustainable loyalty and repeat visitation.
This chapter examines the psychological foundations of family decision-making in the context of activity parks. It introduces the dual-loyalty framework—the recognition that children and parents evaluate parks through fundamentally different lenses and that both must be satisfied simultaneously. It explores what motivates children emotionally and what motivates parents rationally, describes the decision scenarios that emerge from these dynamics, and discusses the triggers that prompt families to visit. Understanding these dynamics is essential for everyone involved in building, operating, or investing in activity parks.
The Dual-Loyalty Framework: Two Decision-Makers, Two Systems
In nearly every consumer market, the person who wants the product is also the person who pays for it. A teenager buying a video game, an adult booking a vacation, a professional purchasing software—in these cases, the evaluation process is unified. Desire, evaluation, and payment occur within a single decision-making framework. The buyer assesses value, compares alternatives, and makes a choice based on personal preferences and priorities.
Family entertainment is fundamentally different. The person experiencing the product (the child) is not the person paying for it (the parent). This creates a dual-loyalty dynamic where both parties must be satisfied, but for entirely different reasons and through entirely different mechanisms. Children create demand pressure. They express enthusiasm, make requests, plead, negotiate, and in some cases wear down parental resistance through sheer persistence. Their influence is primarily emotional and behavioral: I want to go! All my friends go there! Please, please, please!
Parents control the spending decision. They evaluate cost, assess safety, consider convenience, judge developmental value, and ultimately decide whether to authorize the expenditure and allocate the time. Their decision-making is primarily cognitive and evaluative: Is this worth the money? Is it safe? Does this fit our schedule? Will this benefit my child? The tension and interplay between these two forces determine whether a family visits once, visits repeatedly, becomes members, or never returns. Understanding and managing this dual dynamic is not optional—it is the central strategic challenge of operating a children's activity park.
A park that children love but parents distrust or find inconvenient will struggle with retention. Families may visit occasionally when children's requests become overwhelming, but frequent visitation and membership conversion will be limited. A park that parents approve of but children find boring will lose traction as children's enthusiasm wanes and demand pressure disappears. Parents may encourage or even require visits because they believe it is beneficial, but without genuine child enthusiasm, the effort becomes unsustainable. Success requires satisfying both stakeholders simultaneously, creating experiences and communications that activate both the emotional system of children and the rational evaluation system of parents.
What Motivates Children: Emotional Triggers
Children, particularly those in the preschool and early elementary years, make decisions primarily through emotional and experiential systems. Their preferences are shaped by immediate feelings, sensory intensity, social dynamics, and memory of peak moments rather than abstract cost-benefit analysis or long-term planning. Understanding these drivers is essential to creating experiences that generate the kind of enthusiastic demand that brings families through the door and keeps them coming back.
Fun Intensity and Emotional Peaks
The most fundamental driver of child preference is simple: it has to be fun. But fun is not a uniform experience, and understanding how children evaluate enjoyment reveals important design principles. Research on memory and decision-making shows that people judge experiences based on the most intense moment (the peak) and the final moment (the end), not the average quality throughout. This is known as the peak-end rule, and it has profound implications for experience design.
For children, this means that creating moments of high emotional intensity—moments of excitement, surprise, delight, or triumph—has disproportionate impact on their overall evaluation of the experience. A child may spend 90 minutes engaged in moderate enjoyment, but it is the thrilling descent down a particularly steep slide, the surprise of discovering a hidden play area, or the exhilaration of successfully completing a difficult challenge that they remember and talk about afterward. These peak moments shape memory more than the sum total of time spent, and memory shapes whether children demand to return.
Parks that understand this principle design for emotional peaks, not just steady engagement. This might involve signature attractions that deliver high-intensity experiences, surprise elements scattered throughout the environment, or staff-led moments of recognition and celebration that create emotional highlights. It also means paying particular attention to endings—how children leave the facility matters enormously for their remembered satisfaction. A child who leaves disappointed or frustrated will remember the experience negatively regardless of how much fun they had during the middle portions. Creating strong, positive closing rituals or experiences can significantly enhance overall satisfaction and drive return visitation.
Novelty and Sensory Stimulation
Children are powerfully drawn to novelty—new experiences, new challenges, new sensory stimuli. This is not a character flaw or a sign of short attention spans; it is a developmentally appropriate response. Children's brains are wired to seek out and attend to novel information because novelty drives learning. The unfamiliar captures attention, generates excitement, and creates the kind of engagement that facilitates memory formation and skill development.
For park operators, this has two important implications. First, initial visits must deliver strong novelty. The environment should feel different from home, school, or other familiar settings. The level of sensory stimulation, the variety of activities, the physical challenges, and the social opportunities should all exceed what children experience in their everyday environments. This contrast creates excitement and makes the visit memorable.
Second, repeat visitation requires managing novelty decay. If the environment remains static visit after visit, children's excitement will naturally diminish as the experience becomes familiar. What felt thrilling on visit one becomes routine by visit five. This does not mean constant expensive renovations are required. Novelty can be maintained through rotating elements, seasonal themes, temporary challenges, new activities introduced periodically, or progressive difficulty systems that unlock new experiences as children advance. The goal is to create the feeling of ongoing discovery and evolution rather than static repetition.
Mastery and Competence
Beyond passive enjoyment, children are powerfully motivated by mastery—the experience of getting better at something, overcoming a challenge, or achieving something they could not do before. This aligns with self-determination theory's concept of competence as a core psychological need. When a child successfully navigates an obstacle course that seemed too difficult, climbs to the top of a challenging structure, or completes a mission that required effort and strategy, they experience a sense of accomplishment that is intrinsically rewarding.
This is distinct from fun in the pure enjoyment sense; it is pride. It is the satisfaction that comes from effort and achievement. Parks that create pathways for visible skill progression—whether through physical challenges of increasing difficulty, achievement systems that track and recognize progress, or staff recognition of accomplishments—tap into this motivational system. The key is making progress visible and meaningful. Children need to be able to see that they are advancing, that today they can do something they could not do last week or last month.
This creates a different type of motivation than novelty or pure fun. While novelty creates excitement, mastery creates attachment and identity. Children begin to see themselves as capable in this environment, as someone who is good at these activities. That self-concept becomes part of their identity and creates loyalty that persists even when novelty fades. A child who identifies as an accomplished climber or obstacle course master has internal motivation to return that is more durable than simple enjoyment. For operators, this means that progression should not be accidental; it should be intentionally built into the design of activities, staff interactions, memberships, and repeat-visit programs.
Belonging and Social Connection
For school-aged children in particular, peer relationships become a central organizing force in their lives. Being where friends are, doing what friends do, and feeling part of a social group are powerful motivators. If a child's friends visit a particular park, that child will want to go as well. If visiting the park becomes associated with social belonging—this is where kids like me go—the motivation to return strengthens significantly. Conversely, if a child does not see peers they recognize or if they feel socially excluded or isolated during visits, their enthusiasm will wane even if the physical attractions are excellent.
Parks can influence this dynamic by creating opportunities for social interaction, facilitating group activities, and designing spaces that encourage collaborative rather than solitary play. The physical layout can promote interaction by creating bottlenecks or convergence points where children naturally encounter each other. Activities that require cooperation or friendly competition create natural social connections. Birthday parties and group events serve not just as revenue streams but as social seeding mechanisms that introduce peer groups to the park and create shared associations.
The social dimension also creates network effects that strengthen over time. As more children from a particular school or neighborhood start visiting, the park becomes the default gathering place for that social network. Children advocate for visits because they know their friends will be there. This social embedding creates loyalty that is resistant to competitive pressure because switching to a different park means leaving their social network behind. Operators who recognize and cultivate these network dynamics can build powerful competitive advantages through community embedding.
Autonomy and Choice
Even young children value autonomy—the experience of making their own choices and having control over their own actions. This is another core need identified in self-determination theory. In practical terms, this means that children prefer environments where they can choose what to do, how long to do it, and what to try next—rather than being directed through a fixed sequence by adults. Parks that offer multiple activity zones, allow children to move freely between them, and provide options (rather than a single prescribed path) satisfy this need for autonomy.
This does not mean eliminating structure or rules. Safety protocols, operating procedures, and behavioral expectations are necessary and appropriate. But within those constraints, the environment should feel open and self-directed from the child's perspective. They should feel like they are in charge of their own experience, making meaningful choices about how to spend their time rather than following a predetermined program. This sense of agency creates satisfaction and engagement that structured, adult-directed activities cannot replicate.
What Motivates Parents: Rational Evaluation Filters
Parents approach the decision to visit an activity park through a fundamentally different lens than children. While they care deeply about their child's happiness, they also evaluate the experience through a series of rational and semi-rational filters related to safety, value, convenience, and developmental benefit. These filters operate largely at the conscious, evaluative level, though emotional factors like trust and social validation also play important roles.
Safety and Trust
Safety is non-negotiable for parents. A parent who does not trust that their child will be safe—physically, emotionally, and socially—will not visit, regardless of how enthusiastically the child requests it. This evaluation operates on two levels: actual safety (the objective measures in place) and perceived safety (the parent's subjective sense of security). Both matter enormously, and they do not always align.
A park may have excellent safety protocols, well-maintained equipment, trained staff, and a strong safety record. But if the environment appears chaotic, if staff seem inattentive or unprofessional, if cleanliness is poor, or if other children's behavior seems out of control, parents will perceive it as unsafe even if the statistical risk is actually low. Perception shapes behavior more than reality in this domain. Parents will not return to a facility they perceive as unsafe regardless of what accident statistics might suggest.
Trust extends beyond physical safety to encompass social safety (Will my child be bullied or excluded?), hygiene (Is this place clean? Could my child get sick here?), and supervision (Are there enough staff watching? Are they trained and attentive?). Building trust requires consistency, professionalism, visible safety measures, and transparent communication. It requires not just doing safety well but demonstrating it in ways that parents can see and understand. Staff presence, clean facilities, clear rules enforced consistently, and visible maintenance all contribute to perceived safety and build the trust necessary for repeat visitation.
Convenience and Logistics
Even if a park is safe and valuable, if it is difficult to access, hard to schedule, or logistically burdensome, many families will visit less frequently or not at all. Convenience encompasses several dimensions: physical location and ease of travel, availability of parking, clarity and simplicity of booking or admission processes, availability of time slots that fit family schedules, and the ability to combine the visit with other errands or activities.
For time-constrained parents—which is most parents—reducing friction in every step of the process is critical. Complex booking systems, unclear pricing, inadequate parking, or inconvenient hours can all serve as barriers that reduce visitation frequency even among otherwise satisfied customers. The easier it is to visit, the more often families will visit. Conversely, friction compounds over time, gradually eroding participation even when satisfaction with the core experience remains high.
This has direct operational implications. Online booking systems should be intuitive and mobile-friendly. Pricing should be transparent and easy to understand. Parking should be adequate and clearly marked. Hours should align with family availability, including evenings and weekends. Check-in processes should be fast and efficient. Every point of friction removed is a barrier to churn eliminated. In competitive markets, convenience can be a major differentiator even when core offerings are similar.
Developmental Justification
Many parents, particularly those who are educated and middle-class, seek activities for their children that offer developmental benefit beyond mere entertainment. They want to feel that the time and money spent are contributing to their child's growth—whether physical, cognitive, social, or emotional. This is not universal across all demographic segments, but it is a powerful motivator for a large and affluent portion of the market.
This does not mean that parks need to feel like school or that every moment needs to be explicitly educational. In fact, overly didactic or obviously educational approaches can backfire, turning children off and undermining the fun that drives their demand. But parents respond positively to environments that they perceive as supporting healthy development: opportunities for physical exercise and motor skill building, social interaction with peers that develops social competence, problem-solving and creative play that builds cognitive skills, and safe risk-taking that builds confidence and resilience.
The key is that this value must be legible to parents—not assumed or implicit, but visible and understandable. This can be communicated through marketing language that connects activities to developmental outcomes, environmental design that showcases developmental features (such as age-appropriate zones labeled with their developmental purposes), and direct observation during visits where parents can see their children mastering challenges, collaborating with peers, or displaying growing confidence. When parents can point to tangible developmental outcomes, they can justify the expense to themselves, to partners, and to others, which reduces price sensitivity and increases willingness to return.
Value for Money
Parents evaluate whether the experience justifies the cost. This is not purely about the absolute price; it is about perceived value—the relationship between what is paid and what is received. Value perception is influenced by numerous factors: the quality and variety of attractions, the length of time children remain engaged, the quality of the environment (cleanliness, design, ambiance), additional services like food, seating, and amenities for parents, the overall experience quality including staff interactions, and comparative pricing relative to alternatives.
Importantly, value is subjective and varies by family income, local market norms, and individual priorities. A price point that feels reasonable to one family may feel prohibitive to another. There is no single correct price; there is only appropriate pricing for the target market and the value delivered. Understanding the target market's value expectations and ensuring that the delivered experience consistently meets or exceeds those expectations is fundamental to sustainable pricing and retention.
Parks can influence value perception in multiple ways. Bundling services (admission plus food plus party credit) can make pricing feel more generous even at higher absolute prices. Membership structures that reduce per-visit cost create strong value perception for frequent visitors. Premium tiers that offer elevated experiences justify higher prices while making standard pricing feel more accessible by comparison. The goal is not to be the cheapest option but to be the best value—the option where families feel they receive excellent return on their investment.
Social Proof and Validation
Parents are influenced by what other parents do and say. If other families they know and respect visit a park, if online reviews are positive, if the park is visible and active in the community, parents perceive it as a validated, trustworthy choice. Social proof operates as a heuristic—a mental shortcut—that helps parents make decisions more quickly and with greater confidence. When many other parents have made the same choice and report satisfaction, it reduces perceived risk and increases confidence in the decision.
Conversely, lack of visible participation by peers, negative reviews, or absence from local parental networks can create doubt and hesitation. Parents wonder: If this place is so good, why don't I see other families talking about it? Why aren't there more reviews? Social proof creates a reinforcing cycle: initial success attracts more customers, which creates more visibility and social proof, which attracts still more customers. Lack of social proof creates a negative cycle where hesitation prevents trial, which prevents the generation of reviews and word-of-mouth, which perpetuates hesitation.
Parks can influence social proof through multiple channels. Encouraging satisfied customers to leave reviews and testimonials builds online credibility. Creating shareable moments that families post on social media increases visibility within parental networks. Hosting community events that increase local presence and awareness builds familiarity. Building relationships with parent networks, schools, and local organizations creates endorsement effects. Active management of online reputation and community presence are not optional marketing activities—they are essential trust-building mechanisms that directly influence parent decision-making.
The Four Decision Scenarios: Navigating Alignment and Conflict
The dual-loyalty dynamic creates four possible decision scenarios based on the alignment or misalignment between child enthusiasm and parental approval. Understanding these scenarios helps diagnose where a park stands with different customer segments and what interventions might be needed to improve retention and loyalty.
Scenario 1: High Child Enthusiasm + High Parent Approval = Ideal Loyalty
When both children and parents are satisfied—children find the park exciting and fun, and parents find it safe, convenient, valuable, and appropriately priced—loyalty becomes nearly automatic. Visits become routine. Memberships are renewed without hesitation. Word-of-mouth recommendations flow naturally. Price sensitivity decreases because the value is clear and unquestioned. This is the ideal state that every park should strive to create consistently across its customer base.
In this scenario, the park has achieved alignment between child emotional satisfaction and parent rational approval. Children create persistent demand pressure, and parents are happy to satisfy that demand because they agree with the choice. The reinforcing dynamic is powerful: children's enthusiasm validates parents' decision to spend money there, and parents' approval reinforces children's attachment to the place. This creates stable, long-term relationships that are resistant to competitive pressure and economic headwinds.
Achieving this scenario requires excellence in both child-facing experience design and parent-facing operational delivery. The experiences must genuinely delight children through fun, novelty, mastery, and social connection. Simultaneously, operations must earn parental trust through safety, cleanliness, professionalism, convenience, and clear value communication. When both elements are strong, the business becomes sustainable and scalable. When either element weakens, loyalty begins to erode even if the other remains strong.
Scenario 2: High Child Enthusiasm + Low Parent Approval = Tension and Gradual Decline
When children love the park but parents have reservations—perhaps they find it too expensive, perceive safety issues, question its developmental value, or find it inconvenient—tension emerges. Parents may allow occasional visits to satisfy the child and avoid conflict, but they resist frequent visitation or membership. The child's demand is strong, but parental resistance acts as a brake on frequency and spending.
Over time, as financial pressure mounts, as alternative options emerge, or as parents' concerns deepen, the family gradually disengages. Visits become less frequent. Membership renewal is declined. Parents actively seek alternatives that they feel better about approving. This scenario is particularly important to recognize because it may not be immediately visible in operational metrics. The park appears successful because children are having fun and visits are occurring. But long-term retention suffers because parents are not convinced.
Addressing this scenario requires either changing parent perceptions through better communication, visible improvements, or trust-building, or genuinely addressing the underlying concerns through operational changes. If parents perceive the park as unsafe, improving visible safety measures and cleanliness is essential. If they question value, better articulation of developmental benefits or pricing adjustments may be needed. If convenience is the issue, improvements to booking systems, hours, or location accessibility must be considered. The key is diagnosing which parental concern is driving the hesitation and addressing it directly.
Scenario 3: Low Child Enthusiasm + High Parent Approval = Gradual Disengagement
The reverse scenario—where parents approve of the park but children are bored or uninterested—also leads to disengagement, though perhaps more slowly. Parents may encourage or even require visits because they believe it is beneficial for their child. They appreciate the safety, the developmental value, the convenience. They want their child to participate in active play rather than screen time. But without genuine child enthusiasm, the demand pressure dissipates.
Children stop asking to go. They resist when parents suggest visits. They show visible disinterest during visits, moving through activities mechanically rather than joyfully. Eventually, parents recognize the futility of forcing an activity their child does not enjoy and seek alternatives that generate authentic enthusiasm. Even the most well-intentioned parent will not sustain long-term participation in an activity their child actively dislikes or finds boring.
This scenario often arises when parks focus too heavily on parent messaging—emphasizing education, development, structure, safety—at the expense of genuine fun and child engagement. The solution is to rebalance the experience toward what children actually enjoy while maintaining the elements parents value. This might involve increasing novelty through rotating attractions or themes, creating more opportunities for social play and peer interaction, adding elements of surprise and discovery, or introducing mastery systems that make progress visible and rewarding. The challenge is making the experience genuinely fun for children without undermining the safety and developmental value that parents require.
Scenario 4: Low Child Enthusiasm + Low Parent Approval = Immediate Churn
When neither children nor parents are satisfied, families simply stop visiting. There is no loyalty, no repeat visitation, and often negative word-of-mouth that deters other potential customers. This is the failure state. While obvious, it is worth noting that poor execution, misaligned positioning, or fundamental concept flaws can lead directly to this outcome.
Avoiding this scenario requires basic competence in both experience design and operational execution. The park must deliver sufficient fun to engage children and sufficient safety, value, and convenience to satisfy parents. When either falls below acceptable thresholds, churn accelerates. Recovery from this state is difficult because negative word-of-mouth spreads faster than positive recommendations, and rebuilding trust after it has been lost requires sustained excellence over time.
Decision Triggers: What Prompts Families to Visit
Understanding why families value parks is one thing; understanding what actually triggers the decision to visit on a particular day or week is another. Several contextual and psychological triggers influence the timing and frequency of visits. Recognizing these triggers allows for more effective marketing timing, programming decisions, and promotional strategies.
Weather and Seasonal Patterns
Ironically, bad weather is often a significant driver of visits to indoor parks. When outdoor options are unavailable due to rain, extreme heat, cold, or snow, families actively seek indoor alternatives. Children have pent-up energy and need outlets for active play. Parents need activities to fill time and keep children occupied. Indoor parks become the obvious solution. This creates predictable seasonal and weather-driven visitation patterns that operators can anticipate and capitalize on.
Parks can position themselves explicitly as weather-independent options in marketing communications. Offering promotions during periods of predicted poor weather can drive traffic during otherwise slow times. Ensuring operational readiness during peak weather-driven demand periods—adequate staffing, well-maintained equipment, efficient check-in processes—is essential to converting weather-driven visits into positive experiences that generate repeat visitation. The worst outcome is for families to visit during bad weather when demand is high, have a poor experience due to overcrowding or inadequate service, and leave with negative impressions that prevent return visits.
Timing and Schedule Gaps
Visits often occur during schedule gaps—weekends, school holidays, breaks, half-days, teacher planning days, summer vacation—when children are out of school and parents need activities to fill time. These periods create predictable demand surges that parks should be prepared for. Conversely, understanding when these gaps occur allows for targeted marketing and programming that converts awareness into bookings.
Parks that align their operating hours, special programming, and communications with these schedule gaps can drive higher utilization and revenue. Offering special programs during school breaks, extending hours during summer vacation, or creating weekday morning programs for young children not yet in school can fill capacity during otherwise slow periods. Conversely, parks that close or reduce hours during peak family availability times miss significant opportunity and frustrate potential customers who cannot visit when they are actually available.
Social Events and Invitations
Birthday party invitations and other social events serve as major triggers for first-time visits. A child invited to a birthday party at a park experiences it for the first time in a fun, social context with friends. This often leads to requests for return visits or for their own birthday party at the same location. This viral, peer-driven mechanism is one of the most powerful customer acquisition channels for family entertainment venues because it comes with social proof (my friend's family chose this place) and direct experience (I had fun there).
Similarly, when friends or peers visit a park and talk about it at school or in the neighborhood, it creates social triggers for other children. If Emma went to that park and had a great time, her friends will want to go too. This underscores the importance of birthday party programs, group events, and creating shareable experiences that spread through social networks. Every birthday party is not just a revenue event—it is a marketing event that exposes multiple potential customers to the facility in the best possible context.
Novelty Seeking and Boredom
When families feel they have exhausted their usual activities or when children express boredom with routine options, the search for novelty becomes a trigger. Families actively seek new experiences or rediscover places they have not visited recently. This creates opportunities for parks to attract lapsed visitors or first-time customers through messaging that emphasizes newness.
Parks can activate this trigger by periodically refreshing elements of the experience, launching new attractions or programs, or re-engaging lapsed visitors with what's new messaging that highlights changes since their last visit. Even small additions or changes can be marketed as reasons to return when positioned effectively. The key is recognizing that families who have not visited in months may need a specific reason to return rather than vague encouragement. Giving them something new to experience provides that reason.
Routine and Habit Formation
For some families, park visits become habitual—part of a regular weekly or bi-weekly routine. This typically emerges after several positive visits and is reinforced by consistency (same day, same time) and by the park becoming integrated into the family's identity and social structure. Once a visit becomes a habit, the decision to attend is no longer actively evaluated each week. It simply happens automatically as part of the routine.
Habit-based visitation is the most valuable form of loyalty because it is automatic and resistant to disruption. Families visit not because they consciously evaluate alternatives each time, but because this is what we do on Saturday mornings. Breaking a habit requires active decision-making, which creates inertia in favor of continued participation. Encouraging this pattern—through memberships that reduce per-visit cost, consistent scheduling of favorite time slots, and community-building that creates social expectations—is a powerful retention strategy that creates stable, predictable revenue streams.
Aligning Child and Parent Triggers: The Art of Dual Satisfaction
The most successful parks do not merely satisfy children or parents independently; they create experiences and communications that simultaneously activate both decision-making systems. A well-designed ritual, for example, might create pride and excitement in the child (emotional satisfaction) while providing parents with visible evidence of their child's development and a shareable social media moment (rational justification and social validation). A pricing structure might feel like a great deal to parents (value satisfaction) while unlocking new experiences that children find exciting (novelty and aspiration).
This alignment does not happen accidentally. It requires intentional design that considers both perspectives at every touchpoint. Facility design must be safe and clean enough for parents to trust, yet exciting and novel enough for children to love. Programming must be fun and engaging for children while framed as developmentally beneficial for parents. Pricing must be economically justified for parents while perceived by children as unlocking special access or status. Communication must speak to both audiences—highlighting fun and excitement for children while emphasizing safety, value, and development for parents. Staff interactions must be warm and engaging with children while professional and reassuring with parents.
When this alignment is achieved consistently, the dual-loyalty dynamic shifts from a tension to be managed into a reinforcing cycle. Children's enthusiasm strengthens parents' conviction that they made a good choice. Parents' validation reinforces children's sense that the park is important and special. This mutual reinforcement creates loyalty that is more stable and durable than either stakeholder's satisfaction alone could generate. It is the difference between a family that visits occasionally when convenient and a family that builds the park into their identity and routine.
Conclusion
Understanding why families choose indoor activity parks requires moving beyond simplistic explanations and engaging with the psychological reality of dual-stakeholder decision-making. Children and parents evaluate parks through fundamentally different lenses—children through emotional, experiential systems driven by fun, novelty, mastery, and social connection; parents through cognitive, evaluative systems focused on safety, convenience, developmental value, and cost justification. Both must be satisfied simultaneously and consistently for sustainable business success.
A park that delights children but fails to earn parental trust or demonstrate value will struggle with retention as parents resist frequent visits and membership despite children's enthusiasm. A park that parents approve of but children find boring will lose demand pressure over time as children stop requesting visits. The goal is not to choose between satisfying children or parents, but to create experiences that generate enthusiastic child requests and confident parental approval simultaneously.
The decision scenarios that emerge from this dual dynamic—ranging from ideal alignment where both parties are satisfied to complete misalignment where neither is happy—determine visitation frequency, membership conversion, word-of-mouth dynamics, and long-term sustainability. Recognizing which scenario your park currently occupies with different customer segments allows for targeted improvements that address the specific source of dissatisfaction or hesitation.
Decision triggers—weather patterns, schedule gaps, social invitations, novelty seeking, and habit formation—provide practical insight into when and why families decide to visit. Understanding these triggers enables more effective marketing timing, programming decisions, operational planning, and promotional strategies. Parks that align their operations and communications with these triggers can drive higher utilization and convert sporadic visitors into regular participants.
This foundational understanding of family decision-making psychology must inform every strategic decision that follows: concept development, attraction selection, pricing strategy, marketing messaging, staff training, and loyalty program design. Without grasping the dual-loyalty framework and the distinct motivations of children and parents, these tactical decisions will lack grounding and coherence. They may succeed occasionally through luck or in favorable market conditions, but they will not create the kind of systematic, repeatable success that builds sustainable competitive advantage.
Families do not choose parks randomly or based solely on proximity and price. They choose based on whether the park meets the distinct, overlapping, and sometimes conflicting needs of two different decision-makers operating through two different psychological systems. The parks that thrive are those that understand this complexity and design their entire operation around serving both audiences exceptionally well—creating joyful experiences for children and trusted, valuable services for parents. When both are achieved consistently, loyalty becomes automatic, word-of-mouth becomes powerful, and business success becomes sustainable.
Summary Points
✓Family decision-making operates through a dual-loyalty system where children create emotional demand pressure through requests and enthusiasm while parents control rational spending decisions by.
✓Success requires satisfying both stakeholders simultaneously and consistently.
✓Children evaluate parks primarily through emotional triggers including fun intensity and peak moments that create memorable highlights.
✓Parents evaluate parks through rational filters including safety and trust (both actual and perceived measures that determine basic willingness to visit).
✓Decision triggers that prompt visits include bad weather driving demand for indoor alternatives when outdoor play is unavailable.
PART II:
INDUSTRY LANDSCAPE
Part II maps the industry you are entering so that every later decision is made with full awareness of the commercial landscape. It clarifies the terminology used across family entertainment, traces the evolution of the sector from outdoor fun centers to today's hybrid multi-activity destinations, and catalogs the modern formats that compete for family time and spending. Understanding this landscape is essential because format choices shape capital needs, staffing models, and customer expectations. By the end of this part you will speak the industry's language fluently and know where your concept fits.
The modern indoor activity park industry suffers from an identity problem. Walk into meetings with developers, investors, or municipal planners, and the terminology becomes a confusing jumble. Some call them family entertainment centers. Others use trampoline parks, play centers, edutainment venues, or active leisure destinations. This linguistic confusion reflects a deeper reality: the industry has evolved so rapidly and diversified so dramatically that no single term captures its full scope. For anyone entering this space—whether as an entrepreneur, investor, franchisee, or property owner—understanding this landscape and its taxonomy is essential. The category definitions affect everything from insurance classifications and regulatory requirements to marketing positioning and competitive analysis.
The stakes of getting the terminology right extend beyond semantics. Insurance companies price policies differently for a children's soft play center versus a trampoline park with aerial attractions. Municipal zoning boards evaluate family entertainment centers under different criteria than educational facilities. Investors assess risk profiles based on format categories, and landlords negotiate lease terms according to how they classify tenant types. The confusion also creates market opportunities. Where traditional categories fail to describe emerging hybrid concepts, pioneering operators can define entirely new positioning strategies. Understanding the industry structure, classification systems, and business potential allows stakeholders to navigate this complexity strategically rather than stumbling through it blindly.
What is a Family Entertainment Center?
The most widely accepted umbrella term in the industry is the Family Entertainment Center, commonly abbreviated as FEC. At its core, an FEC is a purpose-built environment designed for active leisure and entertainment, primarily targeting families with children and teenagers. Unlike massive destination theme parks that rely on tourism and once-a-year visits, FECs serve local community markets and build their business models on frequency. The typical FEC customer visits six or more times per year, often establishing weekly or monthly routines. This frequency model fundamentally shapes every aspect of the business, from loyalty program design to attraction refresh cycles to food and beverage strategies.
Most FECs operate indoors, though some hybrid formats incorporate outdoor elements. The indoor focus provides year-round operation regardless of weather, a critical advantage for creating predictable revenue streams and membership models. Scale varies dramatically, from intimate neighborhood play cafés of 300 square meters to flagship entertainment complexes exceeding 10,000 square meters. Despite this size variation, successful FECs share common characteristics. They feature multiple anchor attractions rather than relying on a single activity type, creating broader appeal across age groups and interests. They prioritize safety and cleanliness to build parental trust. They design for repeat visitation through progressive skill development, collectible systems, membership benefits, and social embedding. They recognize that serving families means satisfying two distinct customers simultaneously: children seeking fun and excitement, and parents evaluating value, safety, and developmental benefit.
The FEC model differs fundamentally from traditional amusement parks in several ways. Where theme parks charge premium prices for occasional visits, FECs typically offer moderate per-visit pricing with strong membership incentives. Where theme parks invest heavily in theming and storytelling, many FECs focus resources on equipment quality and operational excellence. Where theme parks require destination travel, FECs embed themselves in neighborhoods and shopping centers. Where theme parks create passive, ride-based experiences, FECs emphasize active, self-directed play. These distinctions create different unit economics, marketing strategies, and competitive dynamics. Understanding these differences helps operators avoid borrowing inappropriate strategies from the theme park playbook.
A Taxonomy of Park Formats
Within the broad FEC category, several distinct sub-formats have emerged, each with characteristic features, target audiences, and business models. These format distinctions matter because they determine capital requirements, operational complexity, competitive positioning, and growth potential. The boundaries between categories are increasingly blurred as operators experiment with hybrid models, but understanding the archetypal formats provides essential orientation.
Children Entertainment Centers, often called CECs, focus specifically on younger children, typically ages two through nine. The defining feature is Soft Contained Play equipment—elaborate structures of interconnected tubes, climbing nets, slides, ball pits, and activity panels, all designed with padded surfaces and controlled access points. These environments prioritize safety for exploratory play, allowing children to navigate complex three-dimensional structures while parents supervise from comfortable seating areas with clear sightlines. The business model emphasizes birthday parties, which can represent 40 to 60 percent of total revenue. Food and beverage sales to supervising parents provide important secondary income. The relatively low capital costs for soft play equipment and simple operational requirements make CECs accessible entry points for first-time operators, though the narrow age focus limits market size and creates natural churn as children outgrow the concept.
Children Edutainment Centers represent a rapidly growing sub-segment that blends entertainment with explicit educational objectives. These venues embrace a learning-through-play philosophy, offering hands-on activities designed to foster cognitive, social, and problem-solving skills without the formal structure of school. The appeal to parents is powerful: the ability to justify leisure spending as developmental investment. KidZania stands as the global exemplar, operating over 26 locations worldwide with its child-sized city concept where kids role-play more than 100 different careers, from firefighter to surgeon to banker. The immersive environment allows children to earn currency, make spending decisions, and experience adult roles in controlled, age-appropriate ways. Other edutainment concepts take different approaches. Vietnam Fanpekka explicitly bases its design on Finnish educational methods, using a Why questioning approach to encourage exploration and critical thinking. The edutainment format commands premium pricing because parents perceive higher value, but it also requires greater investment in curriculum development, specialized equipment, and staff training. The educational positioning creates partnership opportunities with schools and homeschool networks, opening revenue streams beyond consumer visits.
True Family Entertainment Centers in the industry traditional sense offer diversified attraction mixes designed to engage children, teenagers, and adults simultaneously under one roof. These venues might combine soft play for toddlers, trampoline courts for school-age children, arcade games for teenagers, and even bowling alleys or sports bars for adults. Russia Zamania network exemplifies this multi-generational approach, operating 21 locations with diverse zones serving toddlers through adults. The company innovation extends beyond its parks to include food production, event management services, and summer camps, creating an integrated family entertainment ecosystem. Similarly, Loco Bear in the UAE and India designs its 7,000-square-meter facilities with explicit age segmentation: soft play and slime arenas for young children, trampolines and virtual reality for teenagers, and laser tag and bowling for older visitors and adults. This format maximizes market reach and visit duration, but demands sophisticated operational management to serve multiple distinct customer segments without creating conflicts or confusion.
Location-Based Entertainment venues, or LBEs, represent the premium tier of the market. These are typically large-scale, heavily capitalized projects developed in partnership with major media and entertainment brands. The defining characteristic is the integration of well-known intellectual property to create immersive, themed attractions. The Mattel Adventure Park in Arizona brings Barbie, Hot Wheels, and Masters of the Universe to life through themed zones and branded experiences. The numerous LEGOLAND Discovery Centers worldwide offer LEGO-themed rides, building workshops, and miniature city displays. India Hamleys toy brand has expanded into themed play parks, leveraging its 250-year heritage and trusted name. The LBE model offers powerful advantages: instant brand recognition, built-in marketing through brand parent companies, and strong emotional connections with customers. However, these benefits come with significant costs. Licensing fees can consume 5 to 10 percent of gross revenue. Brand parents impose strict operational and design standards. Development timelines extend as brand approvals add complexity. The high capital requirements and operational sophistication needed make LBEs primarily viable for well-capitalized developers and experienced operators.
The Industry Economic Scale and Growth Trajectory
The global Family Entertainment Center market represents a substantial and expanding sector of the broader leisure economy. Market analyses conducted in 2024 valued the worldwide industry between 32 and 34.6 billion dollars. More significantly, growth projections suggest the market will reach between 70 and 87 billion dollars by the early 2030s, implying a compound annual growth rate approaching 9 to 11 percent. These figures encompass all FEC formats, from small neighborhood play centers to massive entertainment complexes, and span all geographic markets. The scale of the opportunity has attracted increasing attention from private equity investors, real estate developers, and franchise organizations seeking scalable growth platforms.
Regional market dynamics reveal important variations. North America currently dominates the global market, accounting for over 40 percent of worldwide revenue. This leadership reflects several factors: high household incomes providing discretionary spending capacity, established franchising infrastructure enabling rapid brand expansion, abundant retail real estate seeking entertainment tenants, and cultural acceptance of commercial play spaces. However, the Asia-Pacific region is projected to deliver the fastest growth rates over the coming decade. Rapid urbanization concentrates families in dense metropolitan areas where outdoor play space is scarce. Rising middle-class incomes create new markets for family leisure spending. Younger populations mean higher proportions of children in the demographic mix. Shopping mall developments across China, India, Southeast Asia, and the Middle East seek entertainment anchors to drive foot traffic. These dynamics are creating explosive growth in markets that barely existed a decade ago.
Several powerful forces are driving the industry expansion. Perhaps most fundamental is the growing demand for experiential activities over material goods, particularly among younger parents. In an increasingly digital world, families actively seek screen-free, real-world experiences that promote physical activity and face-to-face social interaction. Parents worry about childhood obesity, excessive device usage, and social isolation. Activity parks address these concerns directly, offering active play, peer interaction, and skill development in supervised environments. This positions the industry not as frivolous entertainment but as a response to genuine parental anxieties about child development in the modern era.
The transformation of retail real estate creates powerful tailwinds. As e-commerce continues eroding traditional retail, property owners desperately need new tenant types to fill vacant spaces and generate foot traffic. Entertainment tenants, and particularly family entertainment concepts, deliver exactly what struggling retail centers need: destination appeal, extended dwell times, and weekend traffic. A family visiting an activity park might spend two to three hours on property, during which they also visit other tenants for meals, shopping, or services. This traffic generation makes FECs valuable anchor tenants, enabling lease negotiations from positions of strength. Landlords increasingly offer generous tenant improvement allowances, rent abatement periods, and favorable base rent terms to attract quality entertainment operators. The alignment of interests between struggling landlords and growing entertainment operators creates unusual opportunities for entrepreneurs who understand how to leverage this dynamic.
Technological advancement is reshaping what is possible within activity parks. Virtual reality systems, augmented reality overlays, gamification platforms, and artificial intelligence personalization are transforming parks from static equipment warehouses into dynamic, responsive entertainment environments. These technologies enable attraction refreshment without full equipment replacement, create personalized progression systems that enhance loyalty, and generate data for operational optimization. The integration of digital and physical experiences—sometimes called phygital entertainment—appeals to children growing up with ubiquitous technology while still delivering the active, social benefits parents seek. This technological evolution is raising barriers to entry as customers begin expecting sophisticated digital integration, but it also creates differentiation opportunities for operators who implement technology strategically.
The business model emphasis on recurring revenue through memberships and subscriptions provides unusual resilience compared to pure transactional entertainment. A park with 500 annual members paying monthly fees generates predictable baseline revenue that reduces vulnerability to economic downturns, seasonal fluctuations, or competitive pressure. This recurring revenue stream appeals strongly to investors and lenders, enabling better access to growth capital. The membership model also dramatically improves unit economics. Member acquisition costs are front-loaded, but lifetime value extends over months or years of repeat visits. Members typically purchase more food, attend more events, and refer more friends than transactional visitors. The shift from pay-per-visit to membership models represents one of the most significant business model innovations in the industry recent history.
However, the industry also faces meaningful challenges that temper unbridled optimism. Capital requirements remain substantial, with mid-sized parks requiring one to three million dollars in initial investment. Operational complexity demands sophisticated management across safety, customer service, food service, event coordination, and maintenance. Labor costs are significant and rising, typically consuming 25 to 35 percent of revenue. Competition is intensifying as the industry growth potential attracts new entrants, including well-capitalized franchisors and private equity-backed operators. The proliferation of at-home entertainment options, from streaming services to gaming platforms to social media, competes for family leisure time even if not directly competing for physical entertainment dollars. Success in this environment requires more than simply opening an attractive facility. It demands strategic positioning, operational excellence, marketing sophistication, and continuous innovation to maintain relevance as customer expectations evolve.
Summary Points
✓The Family Entertainment Center (FEC) is the primary industry term, encompassing indoor active leisure destinations serving local community markets through repeat visitation models.
✓Format categories include Children Entertainment Centers (soft play, ages 2-9), Edutainment Centers (learning-integrated play), true Family Entertainment Centers (multi-generational), and Location-Based Entertainment (brand-licensed, premium).
✓The global FEC market was valued at 32 to 35 billion dollars in 2024.
✓North America dominates current market share at over 40 percent, while Asia-Pacific is expected to deliver the fastest growth due to urbanization, rising incomes.
✓Key growth drivers include demand for experiential activities, retail real estate transformation, technological integration, and membership-based recurring revenue models.
✓Terminology matters significantly for insurance classification, regulatory treatment, investor evaluation, and competitive positioning.
The modern indoor activity park did not emerge fully formed. It evolved through distinct waves of innovation, each responding to changing family dynamics, technological capabilities, real estate economics, and cultural shifts in how society views children play. Understanding this evolutionary history provides crucial context for anyone entering the industry. It reveals which concepts have proven durable versus those that flamed out, which business models support sustainable growth versus temporary fads, and which innovations actually changed customer expectations. The history is not merely academic. The same forces that shaped past evolution—parental anxieties, real estate availability, competitive dynamics, capital flows—continue shaping the industry future. Operators who understand historical patterns can anticipate emerging opportunities and avoid repeating past mistakes.
The story spans roughly four decades, from the early 1980s through today. In that time, the industry has transformed from simple outdoor fun centers and fast-food playgrounds into sophisticated, technology-enabled, multi-million-dollar entertainment destinations. The journey includes spectacular successes and dramatic failures, pioneering entrepreneurs and corporate consolidators, breakthrough innovations and imitative me-too concepts. Certain brands—Sky Zone, Urban Air, SuperPark, KidZania, Zamania—have become industry touchstones, studied by operators worldwide. Others, like Discovery Zone, achieved massive scale before collapsing entirely, leaving cautionary lessons about expansion without operational foundation. The through-line connects them all: successful concepts solve real problems for families while building business models that sustain profitability through multiple economic and competitive cycles.
The Precursors: Outdoor Fun Centers and Family Chains
The earliest ancestors of modern activity parks were outdoor entertainment centers that emerged alongside America postwar suburban expansion and car culture. These roadside attractions featured simple amusements: miniature golf, go-karts, batting cages, and arcade games. Putt-Putt, founded in 1954, exemplified this model by creating a standardized, branded miniature golf experience that could be franchised across markets. The business model was straightforward: locate alongside major roads to capture impulse traffic, invest in durable outdoor equipment requiring minimal maintenance, staff with part-time workers, and generate revenue through per-activity pricing. These centers were recreational rather than developmental, targeting families seeking affordable weekend outings. The format limitations were equally clear: weather dependence restricted operating seasons in many climates, equipment became dated without constant investment, and the standalone roadside locations struggled as retail patterns shifted toward enclosed malls and shopping centers.
The outdoor fun center model established several principles that persist in modern parks. The multi-attraction approach proved superior to single-activity venues by accommodating different ages and interests within the same family visit. The focus on family social interaction rather than passive entertainment created memorable experiences that drove repeat visitation. The relatively low capital intensity compared to theme parks made entrepreneurial entry feasible. However, the model inability to generate year-round traffic or build customer loyalty through meaningful relationship mechanisms ultimately limited its growth potential. As shopping malls became America primary gathering spaces in the 1970s and 1980s, the standalone roadside attraction struggled to compete for family leisure time.
The Indoor Revolution: McDonald's and Discovery Zone
The shift from outdoor to indoor entertainment spaces accelerated during the 1980s and 1990s, driven initially by an unlikely source: fast-food marketing. In 1972, McDonald introduced McDonaldland Park, an outdoor playground concept featuring its brand characters. The strategic logic was simple but powerful: playgrounds attract children, children influence family dining decisions, and families with children spend more per visit. The formula worked spectacularly, prompting competitors to add similar playground features. However, the outdoor playgrounds created serious problems. Built primarily with metal equipment and hard surfaces, they generated thousands of injuries annually. Weather limited usability. Vandalism and maintenance proved costly. By the late 1980s, McDonald began moving playgrounds indoors, creating the PlayPlace concept.
The PlayPlace transformation proved revolutionary. Indoor locations enabled year-round operation regardless of weather. Soft contained play equipment—structures built from plastic tubes, vinyl padding, and netting—dramatically reduced injury risks while creating more elaborate, three-dimensional play environments than outdoor playgrounds permitted. Climate control made the spaces comfortable for both children playing and parents supervising. The contained design allowed easier monitoring and security. For McDonald, PlayPlaces increased visit duration, enhanced customer satisfaction, and strengthened competitive positioning. More broadly, they demonstrated the viability of indoor play as a standalone concept, not merely a dining amenity. The soft play equipment manufacturers developed to serve McDonald found a ready market among entrepreneurs recognizing that families would pay admission to visit dedicated indoor playgrounds without the pretense of buying hamburgers.
This realization sparked the indoor playground boom of the early 1990s, epitomized by Discovery Zone. Founded in 1989, Discovery Zone grew explosively, reaching over 400 locations by the mid-1990s and becoming a publicly traded company. The concept was straightforward: large facilities filled with interconnected soft play structures, climbing towers, slides, ball pits, and activity areas, offered on a pay-per-visit or monthly membership basis. The business model targeted children birthday parties as a primary revenue driver, offering party packages that included exclusive use of party rooms, basic food service, and access to play equipment. McDonald itself entered the standalone indoor playground market in 1991 with Leaps and Bounds, attempting to compete with Discovery Zone growth.
For a brief period, Discovery Zone appeared to demonstrate that indoor playgrounds could scale nationally. The company expanded through aggressive franchising and company-owned development. Wall Street embraced the growth story. However, fundamental weaknesses undermined sustainability. The equipment offerings across locations were largely identical, providing minimal differentiation and making the concept easily copied. The narrow age focus meant children outgrew the facilities quickly, creating constant churn. Most critically, the operational model proved more complex than anticipated. Managing birthday party bookings, maintaining cleanliness and equipment safety, staffing facilities, and generating weekday traffic all required sophisticated systems that many franchisees lacked. By 1996, Discovery Zone filed for bankruptcy. McDonald had already closed Leaps and Bounds and sold the remaining locations to Discovery Zone before its collapse.
The Discovery Zone story could be read as a cautionary tale of overexpansion and weak unit economics. However, the more important lesson is validation. Despite Discovery Zone corporate failure, indoor playgrounds did not disappear. Independent operators continued successfully serving local markets. The facilities that survived shared common characteristics: conservative growth strategies, disciplined cost control, strong local marketing, and diversified revenue beyond just birthday parties. The soft play format had proven that families would pay for indoor active entertainment, that birthday parties could anchor revenue models, and that year-round indoor operation solved fundamental problems with outdoor alternatives. These insights would inform the next wave of industry evolution.
The Trampoline Revolution: Sky Zone and Active Entertainment
In 2004, an inventor in Las Vegas named Rick Platt created something he did not initially intend to become a business at all. Platt had designed a wall-trampoline sport, envisioning a new professional athletic competition. To develop the concept, he built an arena featuring interconnected trampolines and angled wall surfaces where athletes could perform acrobatic maneuvers. The professional sport never materialized. However, local skateboarders discovered the facility and asked to use it for recreation, offering to pay admission. Platt agreed, and within months, the unexpected demand became overwhelming. More than 10,000 people visited in the first six months, paying to jump on the trampolines. The discovery was accidental but profound: a massive untapped market existed for active, adrenaline-focused indoor recreation.
Rick son, Jeff Platt, recognized the commercial opportunity and began developing the concept into a scalable business. The facility was named Sky Zone, marking the birth of the indoor trampoline park category. The model differed fundamentally from soft play centers in several ways. The target demographic skewed older, appealing to school-age children, teenagers, and even fitness-oriented adults rather than toddlers and preschoolers. The experience emphasized high-energy physical activity and controlled risk-taking rather than exploratory play. The facility requirements demanded tall ceilings—typically 5 to 7 meters minimum—and substantial floor space for trampoline courts. The equipment costs were higher than soft play structures, but the appeal proved broader and more enduring. Children did not outgrow trampolining the way they aged out of ball pits.
Sky Zone growth accelerated through franchising, and by the mid-2010s, the brand operated hundreds of locations globally. The success spawned numerous competitors: Altitude, Rockin Jump, Defy, and many others. Australia Bounce built a network of 21 parks emphasizing freestyle movement culture and progressive skill development. The trampoline park boom created its own ecosystem of specialized equipment manufacturers, insurance providers, safety standards organizations, and industry conferences. In 2018, Sky Zone was acquired by competitor CircusTrix, creating the world largest trampoline and active entertainment park operator with combined global presence. The consolidation reflected market maturation but also validated the category durability.
The trampoline park wave taught several important lessons that shaped subsequent industry development. First, appealing to older children and teenagers opened larger market segments with greater spending power and longer engagement periods than toddler-focused concepts. Second, positioning around active recreation and fitness rather than childcare or babysitting enabled premium pricing and differentiated positioning. Third, the high-energy, slightly edgy brand identity created viral marketing opportunities through social media, as customers naturally photographed and shared their jumping experiences. Fourth, the format proved adaptable to various real estate contexts, from former big-box retail stores to warehouse spaces to ground-floor locations in shopping centers. Finally, trampolining inherent injury risks highlighted the critical importance of safety protocols, staff training, waiver procedures, and insurance management—lessons that professionalized the entire industry approach to risk management.
The Modern Era: Multi-Activity Hybrids and Global Expansion
The most recent evolutionary phase has been characterized by format convergence and geographic expansion. The pure-play trampoline park and the traditional soft play center are increasingly rare. Instead, operators are building hybrid venues combining multiple attraction types under one roof: trampoline courts, climbing walls, ninja warrior courses, rope challenges, virtual reality experiences, arcade games, and more. Urban Air Adventure Park exemplifies this trend. While originating in the trampoline park wave, Urban Air evolved into a multi-activity concept featuring its proprietary Adventure Hub—a combination of sky coaster, ropes course, and climbing structures—alongside trampolines, warrior courses, and virtual reality bays. With over 160 locations operating and 180 in development, Urban Air demonstrates the scalability of the hybrid model when supported by strong franchising infrastructure and operational systems.
This diversification strategy addresses several competitive vulnerabilities. Offering multiple attraction types broadens age appeal, allowing facilities to serve toddlers through teenagers through adults within the same visit. Varied activities encourage longer dwell times and repeat visitation, as customers can experience different attractions across multiple visits. The attraction mix provides flexibility to refresh the experience by rotating or upgrading specific elements rather than replacing entire facilities. Multiple revenue drivers reduce dependence on any single activity type, protecting against competitive pressure or shifting preferences. The complexity also creates barriers to entry, as replicating a sophisticated hybrid venue requires greater capital and operational sophistication than copying a single-attraction concept.
Simultaneously, the industry has globalized significantly. European markets have seen substantial growth, with concepts like Finland SuperPark expanding to 21 locations across 10 countries. SuperPark differentiates through its sport and wellness positioning, offering nearly 100 different activities focused on physical movement and fitness rather than pure entertainment. The brand has even participated in research with the U.S. National Institutes of Health demonstrating health benefits from active play, enabling positioning around wellness rather than mere recreation. The Middle East, particularly the United Arab Emirates, emerged as a significant growth market, with premium operators like Leo and Loona bringing sophisticated design and immersive interactive attractions to Dubai and Abu Dhabi. Russia Zamania network pioneered integrated entertainment systems, diversifying beyond parks into food production, event management, and summer camps.
The edutainment segment has also matured and expanded globally. KidZania role-play city concept now operates in over 26 locations worldwide, from Mexico City to Tokyo to London to Dubai. The model success stems from its ability to command premium pricing by framing entertainment as educational investment. Parents justify spending because children are learning about careers, financial literacy, and civic participation while playing. The concept creates partnerships with corporate sponsors who pay for branded role-play activities, generating revenue streams beyond customer admissions. Vietnam market shows particularly sophisticated edutainment development, with brands like Fanpekka explicitly basing designs on Finnish educational methods and TiniWorld offering structured educational workshops alongside play areas.
The COVID-19 pandemic tested the industry resilience in 2020 and 2021. Mandatory closures devastated revenues. Social distancing requirements reduced capacity even when reopening was permitted. Consumer anxiety about shared play spaces depressed visitation initially. However, the industry demonstrated surprising recovery strength. Pent-up demand from children starved for social interaction drove strong rebounds as restrictions lifted. Enhanced cleaning protocols and visible safety measures, implemented by necessity during the pandemic, actually strengthened parental trust. The membership models many parks had adopted provided baseline revenue that helped weather closures better than pure transactional models. Outdoor and well-ventilated spaces gained favor. Most significantly, the pandemic accelerated concerns about screen time and digital isolation that already motivated parents to seek active, social, real-world experiences for children. The industry emerged changed but validated.
Regional Development Patterns and Market Maturation
Geographic development patterns reveal important dynamics. North American markets, particularly the United States, pioneered most format innovations and currently have the highest park density. This saturation is driving operators toward smaller markets, secondary locations, and micro-format concepts. Consolidation through acquisitions and franchising creates clearer market leaders while squeezing independent operators. The focus is shifting from pure growth to same-store performance optimization, loyalty and retention programs, and revenue diversification. Markets with early mover advantages—established brands, prime locations, mature operational systems—increasingly dominate their competitive environments.
European markets generally feature higher land costs and more restrictive regulations, leading to more compact formats and greater emphasis on design quality and efficiency. The cultural context also differs; European families may have different leisure patterns, birthday party traditions, and risk tolerances than American counterparts. Successful European operators have adapted formats to local contexts rather than directly transplanting American models. Middle Eastern markets, particularly wealthy Gulf states, support premium positioning with higher price points, extensive theming, and luxury amenities. The extreme heat makes indoor entertainment essential year-round, creating strong market conditions. Asian markets present enormous growth potential but also unique challenges: dense populations, rapidly growing middle classes, limited space in urban cores, different family structures, varying regulatory environments across countries, and strong preferences for educational framing.
The industry maturation is evident in several trends. Equipment manufacturers have professionalized, developing standardized products, safety certifications, and installation protocols. Insurance markets have developed specialized products for activity parks, with risk-based pricing that rewards strong safety records. Industry associations provide knowledge sharing, best practice dissemination, and lobbying for favorable regulatory treatment. Sophisticated operators employ data analytics, CRM systems, mobile apps, and digital marketing rather than relying solely on walk-in traffic. The emergence of industry-specific consultants, design firms, and franchise development specialists indicates the knowledge base has deepened. Investment capital flows more readily to proven concepts with demonstrated unit economics. The Wild West era of pure entrepreneurial experimentation has not ended, but it coexists with increasingly institutionalized development processes.
Summary Points
✓The industry evolved from outdoor fun centers (1950s-1980s) through indoor soft play (1990s) to trampoline parks (2000s) to modern multi-activity hybrids (2010s-present).
✓McDonald PlayPlace pioneered indoor soft play in the late 1980s, demonstrating year-round operation, reduced injury risk, and family appeal of climate-controlled play environments.
✓Discovery Zone achieved rapid growth to over 400 locations in the mid-1990s before collapsing.
✓Sky Zone, founded in 2004, created the indoor trampoline park category, targeting older demographics, emphasizing active recreation.
✓Modern hybrid parks like Urban Air combine multiple attraction types (trampolines, climbing, ninja courses, VR) to broaden age appeal, increase dwell time.
✓The industry has globalized significantly, with strong growth in Europe (SuperPark), Middle East (Leo and Loona), Russia (Zamania), and emerging Asian markets.
The contemporary activity park landscape defies simple categorization. While the previous chapter traced historical evolution through distinct format phases, today market features a complex mosaic of concepts, business models, and positioning strategies. Successful operators must navigate this diversity strategically, understanding both the archetypal formats that define market segments and the emerging trends reshaping customer expectations. The stakes are significant. Parks built on yesterday assumptions about technology, customer preferences, or revenue models risk obsolescence within years. Conversely, operators who spot and capitalize on genuine trends rather than transient fads can establish sustainable competitive advantages and premium valuations. This chapter examines the current format landscape and the forces transforming the industry future.
Understanding the difference between genuine trends and temporary novelties requires careful analysis. Genuine trends reflect fundamental shifts in technology capabilities, economic structures, social patterns, or customer needs. They persist and strengthen over time, ultimately becoming standard expectations rather than differentiators. Temporary novelties generate initial excitement but lack the underlying drivers for sustained adoption. Virtual reality, for example, has cycled through multiple hype phases, but its integration into activity parks only became practical once hardware costs declined, content libraries expanded, and consumer familiarity increased. Gamification seemed like a buzzword until operators discovered it could measurably increase visit frequency and membership retention. The trends examined here have moved beyond speculation to demonstrated impact on successful operations.
The Current Format Spectrum
Adventure and trampoline parks continue representing significant market share, though the pure trampoline-only format has largely evolved into multi-activity concepts. Sky Zone and Urban Air dominate the North American market with hundreds of locations between them. Urban Air trajectory particularly illustrates format evolution: beginning as a trampoline park, the brand systematically added warrior courses, climbing walls, ropes challenges, sky coasters, and virtual reality to create what it terms the Adventure Hub concept. The strategic logic is clear: any single attraction type can be replicated by competitors, but the integrated system of complementary attractions creates a distinctive experience harder to copy. Australia Bounce network takes a different approach, maintaining stronger focus on freestyle movement and progressive skill development while incorporating elements like the Sky Ladder climbing challenge, Skyjoust gladiator combat, and dramatic drop slides. The brand explicitly positions around self-powered adrenaline and participation in a global freestyle movement, appealing to teenagers and young adults seeking athletic challenge and social status rather than simple entertainment.
Multi-format family entertainment centers represent the broadest category, encompassing diverse approaches to serving entire families across multiple age groups. Russia Zamania pioneered this model with 21 operating parks combining extensive attraction variety with operational diversification into food production, event management, and summer programming. The brand significance extends beyond its Russian base; founder experience from Zamania informed the development of Leo and Loona, a premium brand operating in the United Arab Emirates. Leo and Loona showcases how sophisticated operators elevate the family entertainment center concept through high-end design, immersive interactive attractions, and technology integration that appeals to discerning, high-income customers. Similarly, Loco Bear facilities in Dubai and India explicitly design distinct zones for children, teenagers, and adults—soft play and slime arenas for young kids, trampolines and virtual reality for teens, laser tag and bowling for older visitors and parents. This multigenerational approach maximizes market reach and positions the park as a destination for family social experiences rather than just child containment.
Sport-focused activity parks carve out a distinctive niche by emphasizing athletic skill development and wellness benefits. Finland SuperPark exemplifies this positioning, operating 21 locations across 10 countries with nearly 100 different activities focused on physical movement. The brand participation in research with the U.S. National Institutes of Health, demonstrating measurable health benefits from park activities, enables positioning beyond entertainment into wellness and preventive health. This framing resonates with parents increasingly concerned about childhood obesity, sedentary lifestyles, and physical literacy. It also opens institutional revenue channels through school partnerships, physical education programs, and corporate wellness initiatives. The SuperPark model includes a notable design philosophy: digital technology is integrated extensively, but always in service of physical activity rather than as a passive screen-based alternative. Interactive walls, gamified challenges, and performance tracking all require bodily movement, maintaining the core wellness positioning while embracing technological enhancement.
Edutainment concepts continue expanding, though with increasing sophistication beyond simple learning is fun messaging. KidZania remains the global standard-bearer with its elaborate role-play city concept spanning over 26 locations worldwide. The model genius lies in creating genuine educational value—financial literacy, career exploration, civic participation—while maintaining entertainment appeal that keeps children engaged for hours. The dual appeal enables premium pricing justified by developmental benefits while generating corporate sponsorship revenue from brands who pay to operate branded role-play activities. Regional variations show cultural adaptation: Vietnam market features brands like Fanpekka, explicitly based on Finnish educational methods with a Why questioning approach encouraging critical thinking, and TiniWorld, offering Educational-Intellectual playgrounds with weekly structured workshops. These concepts recognize that middle and upper-income parents increasingly view children leisure time as developmental opportunity, creating willingness to pay premium prices for experiences perceived as enriching rather than merely entertaining.
Brand licensing models leverage globally recognized intellectual property to create instant market recognition and emotional connection. The Mattel Adventure Park in Arizona brings franchises like Barbie, Hot Wheels, Thomas and Friends, and Masters of the Universe to life through themed zones and branded attractions. LEGOLAND Discovery Centers offer LEGO-themed rides, building workshops, and miniature city displays, drawing on the LEGO brand 90-year heritage. Even classic toy retailers are entering the space; India Hamleys operates themed play parks trading on its 250-year history as a trusted children brand. The licensing approach offers powerful advantages: immediate brand recognition reduces marketing costs, built-in emotional connections drive visitation, brand parents often provide marketing support and cross-promotional opportunities. However, licensing fees typically consume 5 to 10 percent of gross revenue, brand standards constrain operational flexibility, and dependence on brand parent strategies creates risks beyond operator control.
Regional mega-parks represent the extreme end of the scale spectrum, creating single-location entertainment destinations through sheer size and attraction density. Poland Hopa Lupa, at over 20,000 square meters, bills itself as Europe largest indoor amusement park, combining trampoline zones, go-kart tracks, bumper cars, and virtual reality gaming. The scale creates regional draw, attracting customers willing to drive longer distances for a destination experience not available locally. This model requires substantial capital—often 5 to 10 million dollars or more—and operates best in markets with large population bases, limited entertainment alternatives, and strong economic fundamentals. The risk-reward profile differs fundamentally from multi-unit franchising. A single exceptional location can generate outstanding returns, but lack of diversification means market-specific risks—economic downturns, competitive entry, changing demographics—directly threaten the entire investment.
Technological Integration: The Phygital Experience
The convergence of physical and digital experiences—sometimes termed phygital entertainment—represents perhaps the most significant trend reshaping activity parks. This integration manifests across multiple technologies, each serving different purposes in the overall experience design. Virtual reality systems overlay digital worlds onto physical activities, transforming standard attractions into immersive adventures. A trampoline jump becomes a flight through fantasy landscapes. A climbing wall turns into an escape from pursuing dragons. The technology appeals to digital-native children who expect technology integration while delivering the active, social benefits parents seek. Equipment costs have declined dramatically as VR hardware commoditized, and content libraries expanded as more developers create location-based VR experiences specifically for entertainment venues.
Augmented reality takes a different approach, overlaying digital elements onto the real world rather than replacing it entirely. Mobile apps can turn the entire park into an interactive quest, where children hunt for digital rewards, complete scavenger hunts, or battle virtual opponents using physical locations as the game board. MadPark in Bahrain pioneered augmented reality integration in trampoline parks, allowing guests to see digital representations of themselves on screens as they bounce, creating novel visual effects and sharable content for social media. The technology advantage over VR is lower equipment cost—customers use their own smartphones—and easier scalability across large spaces. The disadvantage is less immersive impact and dependence on customer device capabilities.
Artificial intelligence applications in activity parks are evolving rapidly from experimental to practical. Current implementations focus on personalization: analyzing individual visit patterns, attraction preferences, skill levels, and engagement behaviors to customize recommendations, adjust challenge difficulty dynamically, and deliver targeted communications. A child who frequently visits climbing attractions might receive suggestions for advanced climbing challenges, invitations to climbing workshops, or notifications when new climbing elements are installed. Future applications could be significantly more sophisticated: holographic characters that interact conversationally with children, real-time performance feedback systems that coach skill development, predictive capacity management that optimizes staffing and pricing based on forecasted demand patterns. The limiting factors are currently cost and integration complexity rather than technological capability.
The broader technology infrastructure—booking systems, customer relationship management platforms, point-of-sale integration, mobile apps, digital signage, security cameras, access control—increasingly forms an integrated ecosystem rather than disconnected tools. This integration enables operational capabilities impossible with fragmented systems: a customer books online, receives automated confirmation and reminders, checks in with a mobile pass, accumulates points automatically during the visit, receives targeted upsell offers based on location within the park, completes food orders through the mobile app, and gets post-visit communications customized to their behavior. The experience is seamless from the customer perspective while generating rich data for operational optimization and marketing targeting. Parks that treat technology as isolated point solutions rather than integrated infrastructure miss significant value.
Deep Gamification and Progression Systems
Gamification has evolved from a buzzword to a core loyalty and engagement strategy, though implementation sophistication varies dramatically. Basic gamification—points for visits, simple reward redemption—provides modest engagement lifts. Deep gamification creates comprehensive progression systems that tap into fundamental psychological drivers: achievement, mastery, status, collection completion, social comparison. These systems turn sporadic entertainment consumption into sustained engagement patterns resembling video game addiction mechanics, but channeled toward physical activity and real-world social interaction.
Effective progression systems include multiple interconnected elements. Points economies allow children to earn currency through visits, completing missions, achieving milestones, and demonstrating desired behaviors. The points redeem for rewards ranging from immediate small items to aspirational prizes requiring sustained engagement over months. The key is structuring a reward ladder where short-term wins provide instant gratification while long-term prizes create sustained motivation. Collectible systems—trade cards, achievement badges, seasonal items—exploit the powerful psychological drive for set completion. A child missing one card from a complete set experiences compelling motivation to return until finding it. Limited-edition seasonal collectibles create urgency and fear of missing out.
Streak mechanics and habit formation systems transform irregular visits into consistent weekly routines. A child maintaining a four-week consecutive visit streak feels genuine loss aversion at the thought of breaking it. The system provides streak protection mechanisms—occasional freeze tokens that preserve streaks during missed weeks—maintaining engagement without creating punitive pressure. Visible recognition through leaderboards, wall displays, special lanyards, or exclusive access to premium areas satisfies status-seeking drives. The recognition must be achievement-based rather than purely competitive to avoid discouraging less athletic children. Systems that celebrate participation milestones, kindness demonstrations, or community contribution alongside athletic achievement create inclusive engagement.
Mission and quest systems provide structured goals beyond free play. Daily challenges might ask children to try specific attractions, achieve particular skills, or complete physical fitness benchmarks. Seasonal campaigns create multi-week narratives where children progress through storylines by completing sequential objectives. The missions serve multiple purposes: driving traffic to underutilized attractions, encouraging skill development, extending visit duration, creating talking points for peer social interaction, and generating return visit motivation. The sophistication of these systems now rivals commercial video games, though the progression happens through physical activity rather than screen time.
The Rise of Sportainment and Wellness Positioning
The strategic positioning of activity parks is shifting from pure entertainment toward health, wellness, and athletic development. This reframing responds to powerful cultural currents: parental anxiety about childhood obesity and sedentary lifestyles, concerns about excessive screen time and digital addiction, growing awareness of mental health benefits from physical activity, and increasing interest in athletic skill development outside traditional organized sports. Parks embracing sportainment positioning differentiate from entertainment competitors while appealing to parents desire to invest in children physical and developmental wellbeing rather than merely purchasing amusement.
SuperPark model exemplifies sophisticated wellness positioning. The brand emphasizes physical literacy—fundamental movement skills that support lifelong physical activity—rather than competitive sports performance. Activities are structured to develop coordination, balance, spatial awareness, strength, and cardiovascular fitness through engaging play rather than tedious exercise. The non-competitive framing removes performance pressure that alienates less athletic children while maintaining challenge through personal progression. Participation in actual health research studies provides scientific credibility that pure entertainment venues cannot match. This positioning enables higher pricing, longer visit duration, weekday school partnerships, and corporate wellness program integration.
Ninja warrior concepts leverage the popularity of television obstacle course competitions to create athletic training environments. Children progress through increasingly difficult obstacle courses, developing upper body strength, grip endurance, problem-solving under physical stress, and mental resilience. The format naturally creates skill-based progression systems where children work toward completing harder courses or faster times. Some operators offer structured classes teaching specific techniques, creating program revenue while deepening athletic skill development. The obstacle course format also provides excellent content for social media sharing, as children post videos of successful completions or spectacular failures, generating organic marketing.
The wellness positioning creates meaningful differentiators in saturated markets. Two similar parks in the same area might offer comparable equipment, but one framed as entertainment competes on price and novelty while one positioned around athletic development can command premium pricing justified by developmental value. The wellness framing also strengthens institutional sales channels. Schools are more likely to partner with venues positioned around physical education and skill development than pure entertainment centers. Physical therapists and occupational therapists may refer patients to activity parks framed around developmental benefits. Youth sports organizations might use the facilities for cross-training. These institutional relationships create stable weekday revenue streams and community credibility that purely consumer-focused venues struggle to achieve.
Premium Experiences and Multi-Generational Design
Market segmentation is increasing as operators recognize that families have vastly different price sensitivities, experience expectations, and value perceptions. Premium positioning strategies target high-income families willing to pay substantially more for superior design quality, exclusive experiences, personalized service, and elevated amenities. Leo and Loona in Dubai and Abu Dhabi exemplifies this approach, offering immersive themed environments, cutting-edge interactive attractions, and luxury design standards that justify premium pricing in one of the world wealthiest markets. The business model recognizes that a smaller customer base paying three times the average price can be more profitable than mass-market volume if operational costs are managed appropriately.
Premium positioning extends beyond physical design to service experience. VIP programs offer priority booking, dedicated party hosts, exclusive time slots in popular attractions, premium food and beverage options, and concierge-style service. Some parks create tiered physical environments, with basic admission areas accessible to all and premium zones requiring membership upgrades or special passes. The visible exclusivity creates aspiration among non-premium customers, driving upgrade conversions while delivering genuine additional value to premium members. The psychology parallels airline business class: the premium tier must provide meaningfully better experience to justify pricing, but visible differentiation also serves marketing purposes by making standard service feel limited by comparison.
Multi-generational design recognizes that serving families means engaging parents as active participants rather than passive supervisors. Traditional activity parks treated parents as necessary chaperones to be given adequate seating and WiFi while children played. Modern parks increasingly design parent-specific experiences: high-quality cafés serving premium coffee and adult food options, co-working spaces allowing parents to be productive during visits, adult fitness zones with equipment appropriate for parents exercising while children play, and adult-friendly attractions like climbing walls with difficult routes or VR experiences with mature content. Loco Bear explicit zoning for kids, teenagers, and adults reflects this philosophy taken to its logical conclusion: different family members simultaneously enjoy age-appropriate activities before reconvening for shared meals or social time.
The multi-generational approach solves a fundamental problem in family entertainment: conflicting needs and preferences among family members. A toddler, a tween, and a parent rarely want the same experience. Traditional solutions forced compromise, leaving someone unsatisfied. Multi-generational design allows simultaneous but different satisfaction, improving the experience for everyone while increasing dwell time and secondary spending. The parent who can work remotely from the park café while children play might visit more frequently and stay longer than one who must sit idle. The teenager who finds engaging activities rather than feeling too old for everything will not resist family visits. This inclusive design philosophy is particularly important for membership models, where sustained family engagement over months or years requires all members finding value.
Data Analytics, Personalization, and Predictive Management
The increasing digitization of park operations generates unprecedented data about customer behavior, preferences, and engagement patterns. Sophisticated operators are moving beyond basic reporting—daily attendance and revenue summaries—toward predictive analytics and personalized customer management. Customer relationship management systems now track individual visit histories, attraction preferences, food purchasing patterns, party booking behaviors, social connections with other customers, response to promotions, and engagement with digital communications. This data enables segmentation far more sophisticated than simple demographic categories.
Behavioral segmentation identifies actionable customer groups: loyal advocates who visit frequently and refer friends, silent regulars who visit consistently but do not engage socially, at-risk members showing declining visit frequency, occasional visitors who could convert to membership, and price-sensitive users who only visit during promotions. Each segment receives different communications, offers, and retention strategies. Loyal advocates might receive early access to new attractions and invitations to exclusive events, reinforcing their status and encouraging advocacy. At-risk members trigger automated retention campaigns with personalized offers based on their historical preferences. Occasional visitors receive membership conversion messaging emphasizing cost savings based on their actual visit frequency.
Predictive churn modeling uses machine learning algorithms to identify customers likely to cancel memberships or stop visiting before they explicitly churn. Early warning signals might include declining visit frequency, reduced dwell time per visit, decreased secondary spending, lower engagement with app features, or negative sentiment in feedback responses. Identifying at-risk customers early allows proactive intervention—personalized outreach, special offers, service recovery gestures—that can prevent churn more cost-effectively than acquiring replacement customers. The analytics also reveal systemic issues. If a cohort of members who joined three months ago shows elevated churn risk, it suggests problems with the onboarding experience or initial engagement that need operational fixes rather than individual interventions.
Dynamic pricing and yield management optimize revenue per available capacity unit. During peak demand periods—Saturday afternoons, school holidays—prices increase to manage capacity while capturing higher willingness to pay. During low-demand periods—weekday mornings, back-to-school weeks—targeted promotions fill capacity that would otherwise go unused. The system requires sophisticated forecasting of demand patterns, price elasticity understanding, and technical infrastructure for real-time pricing adjustments. Theme parks have practiced yield management for decades. Activity parks are increasingly adopting similar approaches, particularly as membership models create baseline revenue that makes aggressive off-peak discounting financially viable.
The Path Forward: Sustainability and Innovation
Looking ahead, several emerging trends are likely to shape the industry next evolution. Sustainability and environmental responsibility are moving from nice-to-have to expected standards, particularly among younger parents who prioritize environmental values. Parks are implementing energy-efficient lighting and HVAC systems, using sustainable materials in construction and equipment, reducing single-use plastics in food service, and communicating environmental initiatives as part of brand positioning. Some markets show preference for brands demonstrating social responsibility through community partnerships, inclusive design for children with disabilities, and ethical labor practices. These considerations increasingly influence location decisions, design choices, and operational policies.
Inclusive design for children with sensory sensitivities, physical disabilities, or developmental differences represents both social responsibility and market opportunity. Sensory-friendly sessions with reduced noise, dimmed lighting, and controlled capacity serve children with autism or sensory processing disorders. Adaptive equipment allows children with physical disabilities to participate alongside typically developing peers. Staff training in disability awareness and inclusive interaction improves experiences for families who often struggle to find welcoming entertainment options. The business case is straightforward: these families represent an underserved market willing to pay for genuinely accessible experiences, and inclusive design typically benefits all customers through better wayfinding, clearer communication, and more thoughtful experience design.
The integration of activity parks into broader mixed-use developments is creating new format opportunities. Rather than standalone entertainment destinations, parks increasingly anchor lifestyle centers combining retail, dining, residential, and office uses. The park drives foot traffic benefiting other tenants while benefiting from the traffic they generate. Some developments are integrating parks with coworking spaces, allowing parents to work nearby while children play. Others combine parks with family-friendly restaurants creating dinner-and-entertainment packages. The mixed-use model provides built-in customer traffic and creates community gathering spaces beyond pure commercial entertainment.
Finally, the continued evolution of franchise models is enabling faster growth while maintaining quality standards. Sophisticated franchisors now provide comprehensive support systems: site selection assistance, design and construction management, equipment procurement, training programs, marketing materials, technology platforms, and ongoing operational consulting. This infrastructure allows franchisees to benefit from proven systems while reducing entrepreneurial risk. For franchisors, the model enables capital-efficient growth while generating royalty streams. The challenge is maintaining brand consistency and quality standards across many locations operated by independent owners. Successful franchisors invest heavily in franchisee selection, training, and ongoing support rather than simply selling territories to anyone willing to pay franchise fees.
Summary Points
✓Modern formats include adventure and trampoline parks (Sky Zone, Urban Air, Bounce), multi-format FECs (Zamania, Leo and Loona, Loco Bear), sport-focused parks (SuperPark).
✓Technological integration creates phygital experiences through VR overlay systems, AR mobile experiences, AI personalization, and integrated digital infrastructure for booking, payments, loyalty tracking.
✓Deep gamification systems drive engagement through points economies, collectible systems, streak mechanics, progression ladders, mission structures.
✓Sportainment and wellness positioning differentiates parks by framing activities around physical literacy, athletic development, and health benefits rather than pure entertainment.
✓Premium experiences target high-income segments through superior design, exclusive access, personalized service, and elevated amenities.
✓Data analytics enable behavioral segmentation, predictive churn modeling, personalized communications, and dynamic pricing that optimize revenue per capacity unit and customer lifetime value.
PART III:
STRATEGIC PLANNING
Part III turns strategic thinking into concrete preparation before a single dollar of capital is committed. It walks through rigorous market analysis, disciplined location strategy, and the disciplined concept development process that converts insight into a differentiated offer. These chapters are the most important risk-reduction work an operator will ever do because errors made here are almost impossible to fix later. The output is a validated concept, a defensible trade area, and a location plan that the rest of the business can safely be built on.
Market analysis forms the foundation of every successful activity park venture. Before committing significant capital to construction, equipment, and staffing, developers must validate that sufficient demand exists within their target geography. Understanding the market means going beyond simple population counts to deeply analyze who lives in the area, what drives their leisure spending decisions, how they currently spend their time and money, and what gaps exist in the competitive landscape. This analytical work transforms entrepreneurial intuition into evidence-based decision-making, dramatically reducing the risk of opening a park that fails to attract enough customers to sustain operations.
The market research process combines quantitative demographic data with qualitative psychographic insights to build a complete picture of the opportunity. Demographics tell developers who their potential customers are by objective measures: age, income, household composition, and population density. Psychographics reveal why families make certain choices: their values, lifestyle preferences, spending priorities, and recreational habits. Together, these dimensions allow operators to design concepts that resonate emotionally while satisfying rational evaluation criteria. The competitive analysis layer then positions the new park within the existing leisure ecosystem, identifying what competitors offer, where they fall short, and how a new entrant can differentiate and capture market share.
Effective market research requires both secondary research using existing data sources and primary research that directly engages the target audience. Secondary research provides the broad strokes: market size, growth trends, demographic profiles, and competitive landscape mapping drawn from census data, industry reports, and economic statistics. Primary research adds texture and specificity through surveys, interviews, focus groups, and observational studies that uncover local preferences, unmet needs, and willingness to pay. The combination creates a robust foundation for all subsequent strategic decisions, from concept development to site selection to pricing strategy.
Demographic Analysis: Identifying Your Customer Base
Demographics provide the quantitative foundation for market analysis by describing the population in measurable, objective terms. For activity parks, the most critical demographic variable is the number and age distribution of children within the primary trade area. Parks targeting families with young children must ensure sufficient population density of households with children aged zero to nine, while venues designed for teenagers need concentrated populations of twelve to eighteen year-olds. Age segmentation matters because different developmental stages drive dramatically different attraction preferences, visit patterns, and spending behaviors.
The family entertainment center industry segments its audience into distinct age cohorts, each representing unique opportunities and challenges. Families with young children ages zero to nine seek safe, sensory-rich environments with structured supervision and age-appropriate equipment that supports motor skill development. This segment values predictability, cleanliness, and visible safety measures. Parents in this group are the primary decision-makers, evaluating venues based on developmental benefit, hygiene standards, and convenience. Facilities targeting this demographic must design dedicated toddler zones with soft play equipment, low-height structures, and enclosed spaces that allow close parental proximity while protecting young children from collision risks with older, more energetic users.
The pre-teen segment spanning ages nine to twelve represents the highest projected growth opportunity in the market. Parents of pre-teens increasingly seek experiences that blend entertainment with educational value, a concept the industry terms edutainment. This demographic responds well to attractions that challenge developing skills, incorporate STEM learning elements, and provide measurable achievement through progression systems. Pre-teens begin exercising more independence in their recreational choices, making peer influence and social validation increasingly important. Parks that successfully serve this segment create environments where children feel challenged but capable, supported but independent, and where achievement is visible to both the child and their parent.
Teenagers currently represent the largest visitor volume segment across family entertainment venues. Their primary motivations center on socialization, status within peer groups, and high-adrenaline challenges that provide bragging rights and shareable experiences. Successful attractions for this demographic include competitive elements like laser tag, go-karting, escape rooms, and ninja warrior courses that allow skill demonstration and social bonding. Teenagers exercise significant influence over family leisure decisions despite parents controlling spending, creating a dual-decision dynamic where emotional appeal to the teen must align with rational justification for the parent. The most effective concepts serve both audiences simultaneously through attraction mixes that excite teens while reassuring parents about safety and value.
Young adults ages eighteen to thirty-five bring substantial discretionary income and represent the heaviest per-capita spenders in leisure entertainment. This demographic seeks both nostalgic connections to childhood play and cutting-edge technological experiences. They visit in peer groups, for dates, and as young parents introducing their own children to active recreation. Compact, high-impact experiences that fit within evening or weekend time windows appeal strongly, as do venues that integrate quality food and beverage options with active entertainment. Designing for this segment means creating Instagram-worthy moments, comfortable social spaces, and sophisticated ambiance that avoids feeling exclusively child-focused.
Beyond age distribution, household income levels critically determine market viability. Activity parks require discretionary spending capacity, meaning the target trade area must contain sufficient households with income remaining after essential expenses. Markets with median household incomes below regional averages may struggle to support premium-priced entertainment, while affluent areas can sustain higher price points and more frequent visits. Income analysis should examine not just median figures but the full distribution, identifying concentrated pockets of target demographics even within broader lower-income regions. Urban expansion and new housing developments signal growing markets where demographic trends favor family entertainment investment, particularly when combined with limited existing competition.
Psychographic Profiling: Understanding Motivations and Behaviors
While demographics describe who customers are, psychographics reveal why they make specific leisure choices. This behavioral and attitudinal dimension examines lifestyle patterns, value systems, spending priorities, and decision-making processes. For activity park operators, psychographic insights transform generic population data into actionable understanding of what drives visits, how often families engage in active recreation, what price points feel reasonable, and what amenities create perceived value. The most successful park concepts align attraction design, pricing, marketing messages, and service delivery with the psychographic profile of their target market.
The dominant psychographic trend shaping the industry is the consumer shift toward experiential spending over material consumption. Modern families, particularly younger parents and Generation Z individuals, increasingly prioritize creating memories and collecting experiences rather than accumulating possessions. This preference manifests in growing leisure spending on activities, entertainment, dining, and travel while discretionary spending on physical goods stagnates or declines. Activity parks benefit directly from this macro trend by positioning themselves as memory-making destinations that deliver shareable, story-worthy experiences. Marketing that emphasizes moments over merchandise, connection over consumption, and family bonding over material gain resonates powerfully with experience-oriented demographics.
Parental concern about excessive screen time drives significant demand for active, physical, real-world recreation. Many parents actively seek environments that pull children away from tablets, smartphones, and video game consoles toward face-to-face social interaction and physical movement. This psychographic driver creates opportunities for parks that frame their offering as screen-free alternatives promoting health, development, and authentic social connection. The appeal extends beyond activity itself to parental values: choosing an activity park becomes a statement about parenting priorities and family lifestyle. Operators who understand this psychological dimension craft messaging that validates parental guilt about screen time while positioning park visits as positive, proactive solutions.
The rise of edutainment reflects psychographic demand for leisure experiences that deliver developmental benefits alongside fun. Parents increasingly evaluate entertainment options through a developmental lens, asking whether an activity contributes to their child growth, learning, or skill-building. This creates market opportunities for parks that integrate educational elements, STEM challenges, creative workshops, and skill progression systems into traditional play environments. The developmental framing need not be heavy-handed; subtle incorporation of problem-solving challenges, spatial reasoning activities, and cooperative tasks satisfies parental desire for value-added experiences without diminishing the fun factor that drives child demand.
Post-pandemic, safety and hygiene consciousness remains elevated among family audiences. Parents demonstrate heightened sensitivity to cleanliness, sanitation protocols, and visible safety measures. This psychographic shift means that facilities must not only maintain rigorous cleaning standards but must make those standards visible and communicable. Transparency about safety procedures, staff training, equipment maintenance, and hygiene protocols builds trust and reduces barriers to trial. Parks that communicate safety effectively through both physical evidence and marketing messaging capture risk-averse segments while differentiating from competitors who treat safety as an operational afterthought rather than a marketing advantage.
Technology affinity represents another critical psychographic dimension, particularly among younger parents and teens. Despite concerns about screen time, these audiences expect seamless digital integration: online booking, app-based check-in, digital waivers, mobile payment, and gamified progression tracking. Technology-enhanced attractions like augmented reality, virtual reality, and interactive projection systems generate excitement and word-of-mouth. The key is positioning technology as enhancement rather than replacement of physical activity, using digital tools to amplify active play rather than substitute for it. Parks that successfully integrate technology meet modern convenience expectations while delivering the active, social experiences that differentiate them from home entertainment.
Competitive Analysis: Mapping the Landscape
Understanding the competitive environment requires systematic identification and evaluation of all businesses competing for the same leisure spending within the target trade area. Competition extends beyond direct substitutes like other activity parks to include any entertainment option families consider when deciding how to spend their weekend time and discretionary budget. Comprehensive competitive mapping examines traditional competitors like bowling alleys, movie theaters, and amusement venues alongside indirect alternatives such as sports leagues, outdoor recreation, and at-home entertainment options. The goal is understanding the full choice set families evaluate when making leisure decisions.
Direct competitors share similar formats, target the same demographics, and offer comparable value propositions. For a new trampoline park, direct competitors include existing trampoline venues, adventure parks, family entertainment centers, and indoor playgrounds within the primary trade area. Analysis of direct competitors examines their location, size, attraction mix, pricing, operating hours, customer reviews, and apparent traffic levels. Site visits to competitor locations provide invaluable observational data: How crowded are they during different times? What age groups dominate? What do parents complain about in overheard conversations? Where do service breakdowns occur? What creates delight? These insights reveal operational gaps and differentiation opportunities that surveys and secondary research miss.
The competitive landscape includes both large corporate operators and independent local businesses. Major chains like Sky Zone, Urban Air, and international brands leverage brand recognition, standardized operating systems, national marketing, and corporate sponsorships to drive traffic. These operators benefit from economies of scale in equipment procurement, technology development, and staff training. However, their standardization can create opportunities for locally-focused independents to differentiate through superior service, community integration, flexible programming, and personalized experiences. Understanding whether the market contains corporate franchises or local independents shapes positioning strategy and competitive tactics.
Market saturation analysis determines whether sufficient unmet demand exists to support a new entrant. High competitor density might signal either oversaturation that suppresses returns or validated strong demand that ensures customer availability. The distinction depends on whether existing facilities appear consistently busy, maintain high review ratings, and demonstrate pricing power, or whether they compete primarily on discounting, show sparse attendance, and accumulate negative feedback. Markets with thriving competitors often support additional capacity better than markets with struggling incumbents, as the former indicates robust demand while the latter suggests fundamental market weakness.
Competitive strategy analysis examines how existing players differentiate and compete. Leading operators differentiate through continuous innovation in attraction technology, strategic brand partnerships, and sophisticated data analytics that enable personalized marketing and dynamic pricing. Many leverage RFID wristbands, mobile applications, and customer relationship management systems to track behavior, predict preferences, and prevent churn. Industry consolidation trends see larger groups acquiring independent parks to achieve operational standardization and secure enterprise-level sponsorship deals. Understanding these competitive strategies helps new entrants identify sustainable positioning that established players cannot easily copy or price-match.
Identifying Market Gaps and Opportunities
Market gap analysis synthesizes demographic, psychographic, and competitive insights to pinpoint underserved needs and defensible positioning opportunities. Gaps emerge where significant customer demand exists but current supply fails to satisfy that demand adequately due to capacity constraints, format limitations, service deficiencies, or geographic inconvenience. The most attractive gaps combine strong customer need with weak competitive response, creating openings where a well-designed new entrant can establish market position before competitors react.
One significant emerging gap centers on wellness-integrated recreation that combines active play with health and mindfulness programming. While traditional activity parks focus purely on entertainment and adrenaline, a growing consumer segment seeks facilities that frame physical activity within broader wellness lifestyles. Opportunities exist for concepts that pair climbing walls and ninja courses with yoga spaces, mindfulness zones, and nutritional education. This positioning appeals to health-conscious parents who view recreation through a holistic development lens rather than simple entertainment. The wellness angle also creates partnership opportunities with pediatricians, child development specialists, and health-focused brands seeking authentic community connections.
Geographic gaps represent the most straightforward opportunity identification. Void analysis using demographic data and competitor mapping reveals underserved areas where target populations exist far from quality entertainment options. Suburban communities with strong family demographics but limited local entertainment options often represent attractive markets, as residents currently drive to distant venues and would welcome convenient alternatives. Similarly, growing urban neighborhoods with rising child populations but aging or inadequate entertainment infrastructure create opportunities for modern, well-designed facilities that capture latent demand currently unmet by legacy competitors.
Inclusion and accessibility gaps present both social impact and business opportunities. Many existing parks inadequately serve children with physical disabilities, sensory processing differences, or neurodevelopmental conditions. Designing truly inclusive facilities with adaptive equipment, sensory-friendly sessions, trained staff, and accommodating policies opens underserved market segments while generating positive community impact. Inclusive design need not compromise appeal to neurotypical children; universal design principles create better experiences for all users while expanding the addressable market to families currently excluded from mainstream recreation.
Hybrid physical-digital experiences represent a technological gap many incumbents struggle to fill. While most parks have added isolated VR attractions, few have deeply integrated augmented reality, gamification, and progression tracking throughout the entire facility. Opportunities exist for concepts that layer digital gaming mechanics over physical attractions, creating persistent achievement systems, competitive leaderboards, and social challenges that deepen engagement and drive repeat visits. Younger demographics raised on video games and app-based experiences respond strongly to these hybrid formats when executed well, though poor implementation that prioritizes technology over physical activity can backfire.
The Generation Z demographic presents a positioning gap centered on social shareability and aesthetic experience design. This cohort prioritizes Instagram-worthy moments, visually distinctive environments, and experiences that enhance their social media presence. While many parks focus purely on equipment and activities, gaps exist for venues designed with intentional visual appeal: dramatic lighting, themed zones, photo-worthy installations, and branded aesthetics that encourage user-generated content. This approach transforms visitors into marketers who organically promote the venue through social sharing, creating viral growth potential traditional parks cannot match.
Research Methodologies: Primary and Secondary Approaches
Effective market analysis combines secondary research using existing data with primary research that generates new insights directly from target customers. Secondary research provides efficient, cost-effective access to broad market intelligence: demographic trends, industry growth projections, competitive landscape overviews, and macroeconomic context. Primary research adds depth, specificity, and local context through direct engagement with potential customers via surveys, interviews, focus groups, and observational studies. The most robust market validation employs both methodologies sequentially, using secondary research to frame hypotheses that primary research then tests and refines.
Secondary research sources include census data providing detailed demographic breakdowns by geography, industry market reports from research firms analyzing sector trends and growth projections, and local economic development statistics tracking population growth, housing starts, and employment patterns. These sources reveal macro trends: the family entertainment center market is projected to grow, the nine-to-twelve age segment shows strongest growth potential, urban markets demonstrate higher demand for climate-controlled indoor entertainment. Government census data offers granular neighborhood-level demographic profiles including household income, family composition, age distribution, and population density. Economic development agencies publish reports on regional growth, new residential construction, and commercial development that signal emerging market opportunities.
Industry reports from market research firms provide competitive intelligence, market sizing, and trend analysis. These reports identify key players, market share distributions, pricing benchmarks, and emerging format innovations. While expensive to purchase individually, many are available through business libraries, university resources, or economic development agencies. Trade publications and industry conferences offer additional secondary intelligence through case studies, operator interviews, and vendor presentations that reveal best practices and common pitfalls. This secondary foundation establishes baseline understanding before investing in more expensive primary research.
Primary research methods generate original data specific to the target market through direct customer engagement. Online surveys distributed through social media, parenting groups, and school networks gather quantitative data on interest levels, pricing sensitivity, preferred features, and visit frequency intentions. Effective surveys keep questions concise, use skip logic to maintain relevance, and offer incentives like prize drawings or discount codes to boost response rates. Survey results quantify demand: What percentage of parents express strong interest? What price points generate resistance? Which attractions drive excitement? How far will families travel? This data supports financial modeling and concept validation.
In-depth interviews with parents, school administrators, event planners, and community leaders provide qualitative insights surveys cannot capture. These conversations uncover pain points with existing options, unmet needs, spending decision criteria, and perception of proposed concepts. Interviews reveal the language customers use to describe their needs, the concerns that create purchase hesitation, and the benefits they value most. This qualitative intelligence shapes marketing messaging, service design, and positioning strategy by grounding decisions in actual customer perspectives rather than operator assumptions.
Focus groups bring together small cohorts of target customers for facilitated discussions that test concepts, pricing structures, naming options, and marketing messages. Group dynamics elicit richer feedback than individual interviews, as participants build on each other's ideas and challenge assumptions. Focus groups excel at testing multiple concept variations, observing emotional reactions to visual mockups, and identifying unexpected objections or enthusiasm drivers. Recording sessions allows later analysis of not just what participants say but how they react, which features generate excitement, and where hesitation emerges.
Observational research involves visiting competitor locations to study actual behavior rather than stated preferences. Observers document traffic patterns, crowding levels, age distributions, dwell times, parent behavior, service interactions, and operational pain points. This research reveals gaps between what people say and what they do, identifies service breakdowns competitors fail to address, and generates tactical insights about optimal staffing levels, traffic flow design, and capacity management. Observational research also benchmarks competitive performance, estimating attendance levels and revenue potential based on visible transaction volume.
Summary Points
✓Market analysis transforms entrepreneurial intuition into evidence-based decision-making by validating demand before capital commitment.
✓Demographic analysis identifies target customer concentrations by age, income, and household composition, with different age segments driving distinct attraction preferences and visit patterns.
✓Psychographic profiling reveals why families make leisure choices, uncovering drivers like experiential spending preferences, screen-time concerns, developmental priorities, and safety consciousness.
✓Competitive mapping examines both direct and indirect competitors to identify market saturation, positioning opportunities, and operational benchmarks.
✓Market gaps emerge where significant customer demand exists but current supply inadequately meets that need due to capacity, format, service, or geographic limitations.
✓Effective research combines secondary sources like census data and industry reports with primary methods including surveys, interviews, focus groups, and observational studies.
Location decisions rank among the most consequential choices in activity park development, often determining success or failure more definitively than concept design, marketing prowess, or operational excellence. Unlike pricing strategies or attraction mixes that can be adjusted after opening, location represents a long-term commitment that cannot be easily changed without catastrophic cost. The right location provides natural visibility, convenient access, surrounding demographics that match the target audience, and complementary co-tenants that drive consistent traffic. The wrong location condemns even well-designed parks to struggle with awareness, access barriers, demographic mismatch, and insufficient foot traffic, making profitability nearly impossible regardless of operational quality.
Location strategy encompasses multiple interdependent decisions that must align with the park concept, target audience, and business model. Operators must define their primary trade area and understand drive-time dynamics that determine how far customers will travel. They must establish site selection criteria that filter potential locations based on demographics, visibility, access, infrastructure, and zoning. They must evaluate different real estate formats from shopping centers to standalone buildings to mixed-use developments, each offering distinct advantages and challenges. Co-tenancy analysis determines which surrounding businesses amplify success versus which create conflicts. Finally, lease versus purchase economics shape long-term financial structure and exit options.
Modern location analysis leverages sophisticated data analytics unavailable to earlier generation operators. Anonymized mobile location data reveals where customers actually travel from, how often they visit, what other businesses they frequent, and whether multiple locations risk cannibalizing each other. Drive-time modeling accounts for actual road networks and traffic patterns rather than simple radial distances. Gravity models predict attendance probability based on location attractiveness, distance, and competitive interference. These analytical tools move location selection from intuitive guesswork to data-driven precision, significantly improving success probability while reducing expensive mistakes.
Trade Area Analysis and Drive-Time Modeling
The trade area defines the geographic region from which a business draws the majority of its customers. For activity parks, trade areas are not simple circles radiating from a central point but complex shapes influenced by road networks, traffic patterns, natural barriers, public transportation access, and competitor locations. Understanding the true trade area allows accurate demand forecasting, targeted marketing, and realistic attendance projections. Misdefining the trade area leads to overestimating potential customers, missing key demographic pockets, or failing to account for competitive interference.
Drive-time analysis creates the foundation for trade area definition by mapping how far customers can travel in specified time intervals, typically five, ten, and fifteen minutes. Unlike simple radius studies that assume uniform travel in all directions, drive-time analysis accounts for actual road speeds, highway access, traffic congestion, and network connectivity. A location adjacent to a highway interchange might serve customers fifteen miles away within a ten-minute drive, while a site on congested urban streets might struggle to draw from neighborhoods just two miles distant. The resulting drive-time zones reveal which populations fall within reasonable travel distance and which remain effectively inaccessible despite geographic proximity.
Primary trade areas typically fall within ten to fifteen minutes drive time and generate the majority of visits, often seventy to eighty percent of total attendance. These are the neighborhoods where convenience makes the park a natural choice for regular visits, birthday parties, and membership purchases. Secondary trade areas extend to twenty to thirty minutes and contribute occasional visits, particularly for special events or when combined with other errands. Tertiary trade areas beyond thirty minutes generate minimal regular traffic unless the park offers truly unique attractions unavailable elsewhere. Flagship destination parks with exceptional scale or exclusive offerings can draw from broader trade areas, but most neighborhood and mid-sized facilities depend heavily on their primary zone.
Gravity models add sophistication to trade area analysis by predicting the probability of a customer visiting based on distance, venue attractiveness, and competing alternatives. These models recognize that larger, more attractive venues pull customers from greater distances while nearby competitors reduce draw probability even for close populations. The output visualizes as heat maps showing areas of high and low attendance probability, accounting for the full competitive landscape rather than analyzing the location in isolation. Gravity modeling helps operators understand not just whether people live nearby but whether they are likely to choose this park over alternatives.
Modern trade area analysis increasingly relies on anonymized mobile location data that reveals actual visitor patterns rather than theoretical projections. This data shows where visitors truly come from, how often they visit, what times and days they prefer, and what other businesses they frequent before and after park visits. Analyzing actual foot traffic patterns from similar existing facilities provides empirically grounded trade area definitions far more accurate than demographic modeling alone. This same data enables cannibalization assessment when operators consider opening multiple locations, ensuring a new site expands total market reach rather than simply redistributing existing customers across more facilities.
Site Selection Criteria: The Essential Filters
Systematic site selection applies a consistent set of criteria to evaluate and compare potential locations objectively. These criteria transform subjective impressions into scorable, comparable assessments that support rational decision-making. The most critical factors include demographic match, accessibility and visibility, parking adequacy, zoning compatibility, and infrastructure capability. Each factor should be weighted according to concept requirements and business priorities, with dealbreakers identified early to avoid wasting time on fundamentally flawed sites.
Demographic match between the trade area population and target customer profile represents the foundational requirement. The trade area must contain sufficient concentrations of families with children in the target age ranges, household incomes that support discretionary entertainment spending, and population density that generates adequate visit frequency. A park targeting toddlers and preschoolers needs neighborhoods with high concentrations of young families, while venues designed for teenagers require different demographic profiles. Analyzing census data, school enrollment figures, and household composition within the defined trade area validates that enough potential customers live close enough to sustain the business.
Visibility and accessibility determine whether potential customers know the park exists and can easily reach it. High-traffic roadways with clear sightlines to the building or signage ensure passive awareness as families drive past during daily routines. Complicated access requiring multiple turns, navigating confusing intersections, or fighting heavy congestion creates friction that suppresses visit frequency even among interested customers. Traffic count data reveals how many vehicles pass the site daily and during which hours, while directional analysis shows whether traffic flows toward residential areas during evening hours when families make entertainment decisions. Ideally, the site captures homebound commuter traffic when parents and children are together making plans for the evening or weekend.
Adequate parking removes a major barrier to trial and repeat visits, particularly for family audiences arriving with multiple children, strollers, and gear. Suburban and exurban markets require abundant free parking immediately adjacent to the entrance, while dense urban locations can succeed with less parking if served by public transportation. The parking requirement scales with facility capacity: larger parks hosting birthday parties and group events need substantially more spaces than small neighborhood play cafés. Shared parking with complementary businesses works well when peak hours do not overlap, but conflicts with restaurants or cinemas that peak during the same evening and weekend periods can create insufficient capacity during the park's busiest times.
Zoning and regulatory compatibility must be verified early to avoid expensive surprises late in the process. The property must be zoned for commercial or recreational use, with activity parks potentially requiring special use permits depending on local ordinances. Noise regulations may restrict operating hours or attraction types. Building codes dictate requirements for occupancy capacity, accessibility, fire safety, and emergency egress. Health department regulations govern food service capabilities. Navigating these regulatory requirements often proves time-consuming and unpredictable, making early consultation with municipal authorities essential. Properties already hosting entertainment or recreational uses typically face fewer regulatory hurdles than sites requiring zoning variances or use changes.
Infrastructure capability determines whether the building can physically support the intended operations without prohibitively expensive upgrades. Critical infrastructure elements include electrical capacity for lighting, climate control, kitchen equipment, and attraction systems; HVAC capacity to handle high occupancy and active play heat generation; plumbing for adequate restrooms, kitchen water supply, and drainage; telecommunications for internet, payment processing, and security systems. Environmental assessments check for soil contamination, flood risk, and hazardous materials that could complicate or prevent development. Expansion potential allows future growth through facility additions or enhanced attractions without relocating, protecting long-term investment as the business matures.
Real Estate Formats: Choosing the Right Model
Activity parks develop across diverse real estate formats, each offering distinct strategic advantages and operational considerations. The format choice influences visibility, traffic generation, infrastructure costs, operational control, and long-term flexibility. Understanding these format options allows developers to match real estate strategy with concept positioning, capital availability, and market dynamics.
Standalone facilities provide maximum control and visibility through custom-built or extensively renovated buildings dedicated entirely to the park. This format allows complete design freedom, prominent signage, dedicated parking, and strong brand presence without landlord restrictions or co-tenant conflicts. Standalone locations work particularly well for destination concepts that generate their own traffic through marketing and reputation rather than relying on surrounding foot traffic. However, this format requires the operator to attract every customer independently without benefit from complementary businesses, places full responsibility for property maintenance and taxes on the operator, and typically demands higher capital investment for land acquisition or long-term lease commitments.
Repurposed retail boxes and industrial warehouses offer cost-effective alternatives to ground-up construction by leveraging existing structures. Former department stores, grocery stores, cinemas, and warehouses often provide the large footprints and high ceilings activity parks require. These buildings frequently become available at attractive lease rates as traditional retail struggles with e-commerce competition and changing consumer preferences. Landlords of struggling retail properties may offer favorable tenant improvement allowances and rent concessions to secure entertainment anchors that drive traffic benefiting remaining tenants. However, repurposed spaces may require significant infrastructure upgrades, layout modifications to achieve optimal flow, and careful evaluation of structural capacity, particularly floor loading for heavy equipment and ceiling attachment points for elevated attractions.
Shopping centers and retail plazas embed parks within established commercial ecosystems that generate consistent foot traffic. Co-location with complementary businesses like family restaurants, grocery stores, toy retailers, and children's apparel creates synergistic traffic where customers visiting for one purpose discover and trial the park. The landlord typically handles common area maintenance, parking management, and property-level marketing, reducing operational burden. Shopping centers provide built-in visibility to customers already in a spending mindset. However, this format subjects operators to lease terms favoring landlords, operating hour requirements, common area maintenance charges, and potential restrictions on exterior modifications, signage, or exclusive territories.
Mixed-use developments represent the fastest-growing format, integrating entertainment with retail, dining, residential, and office space in walkable, 24-7 environments. These districts function as self-sustaining ecosystems where people live, work, dine, and play within a single development. Activity parks in mixed-use projects benefit from consistent traffic across multiple dayparts, built-in residential customer bases, and positioning within lifestyle destinations that attract affluent demographics. Developments like The Battery Atlanta and OCVibe in Anaheim demonstrate how sports anchors, entertainment venues, restaurants, and residential towers create vibrant destinations where activity parks thrive as integral components rather than isolated attractions. The trade-off comes through premium rents, exacting landlord standards, longer approval processes, and integration requirements that limit operational independence.
Co-Tenancy and the Power of Complementary Neighbors
The surrounding business ecosystem profoundly impacts park performance by either amplifying success through complementary traffic or creating conflicts through competition and incompatibility. Strategic co-tenancy analysis identifies which neighbors generate qualified traffic, which create operational synergies, and which should be avoided. The strongest co-tenant mixes align target demographics, reinforce positioning, and encourage extended dwell time across multiple venues within a single trip.
Family-friendly restaurants represent ideal co-tenants by serving the same demographic and encouraging combined outings where families dine before or after park visits. Fast-casual concepts, pizza restaurants, and family dining chains drive consistent traffic throughout the day and week, with peak periods overlapping park demand. This alignment creates cross-referral opportunities and positions both businesses as components of a family entertainment district. Grocery stores also generate strong traffic from family shoppers visiting routinely, creating awareness and convenient combination trip opportunities. Parents picking up groceries for the week might add a quick play session, while those planning weekend entertainment naturally consider the park seen regularly during routine shopping.
Toy retailers, children's apparel stores, bookstores, and educational enrichment centers create thematic coherence around family and child-focused shopping. These neighbors attract the precise target demographic during shopping expeditions already focused on children's needs, making park consideration natural. Cinemas provide complementary entertainment options that families might alternate between, while their different peak hours mean less parking and traffic conflict. Complementary entertainment creates choice within a district, allowing families to customize outings and encouraging repeat visits to the broader area even when they select different specific activities each time.
Activity parks increasingly function as anchor tenants themselves, reversing traditional retail patterns where department stores drove traffic benefiting smaller tenants. Landlords actively recruit family entertainment concepts to replace declining department stores as traffic generators that justify visits for retail, dining, and service tenants. This anchor positioning provides negotiating leverage for favorable lease terms, tenant improvement allowances, and co-tenancy protections. Parks that successfully drive traffic for neighbors strengthen their strategic position within the development and relationship with the landlord, potentially leading to expansion opportunities, lease concessions, or favorable renewal terms.
Void analysis identifies retail centers and districts with strong complementary tenant mixes but missing entertainment anchors. A shopping center filled with family restaurants, toy stores, children's services, and grocery traffic but lacking indoor entertainment represents a clear void that a well-designed park could fill. This analytical approach targets locations where the ecosystem is primed for an entertainment anchor, where landlords feel pain from the missing component, and where customer demand is proven through existing family traffic. Void analysis transforms site selection from finding available space to identifying strategic opportunities where the park completes an incomplete puzzle.
Lease Versus Purchase: Economic Implications
The decision to lease or purchase property carries profound financial implications affecting capital requirements, operational flexibility, long-term profitability, and exit options. Neither option is universally superior; the optimal choice depends on capital availability, risk tolerance, market stability, and strategic time horizon. Understanding the full economic impact beyond simple monthly payment comparisons ensures this decision aligns with overall business strategy.
Leasing minimizes upfront capital requirements by avoiding property acquisition costs, allowing developers to allocate more capital to equipment, build-out, technology, and working capital. This capital efficiency proves particularly valuable for first-time operators with limited access to funding or those pursuing rapid multi-unit expansion where property ownership would exhaust capital. Landlords typically assume responsibility for structural maintenance, roof repairs, parking lot upkeep, and major building systems, reducing operational complexity and unexpected capital expenditures. Lease flexibility allows operators to exit underperforming locations more easily than owned properties, limiting downside risk if market conditions deteriorate or concept performance disappoints.
However, leasing subjects operators to landlord control over rent increases, operating expense passthroughs, and property-level decisions. Lease structures often include escalating base rents, percentage rent tied to revenue, and pass-through charges for property taxes, insurance, and common area maintenance that can increase unpredictably. Long lease terms required for entertainment concepts often span ten to fifteen years to justify high tenant improvement costs exceeding four hundred dollars per square foot. These long commitments reduce flexibility to adapt to changing markets while potentially locking in unfavorable terms if market rents decline. Additionally, lease payments generate no equity, meaning years of rent payments produce no asset value for the operator.
Property ownership requires substantial upfront capital for purchase and places full responsibility for maintenance, taxes, insurance, and repairs on the operator. This capital intensity and operational complexity create higher barriers and risk, particularly for unproven concepts or first-time operators. However, ownership provides long-term cost stability with fixed mortgage payments rather than escalating rents, complete control over property modifications and expansion, and equity accumulation as the property appreciates. Owned properties strengthen balance sheets, provide collateral for additional borrowing, and create exit value through property sale separate from business operations. Successful parks can eventually operate mortgage-free with only property taxes and maintenance as occupancy costs, dramatically improving profitability in mature operations.
The lease-versus-purchase decision should incorporate analysis of long-term total cost of occupancy, capital efficiency and opportunity cost, operational control and flexibility requirements, and exit strategy implications. Markets with stable or appreciating property values favor ownership, while uncertain or declining markets make leasing less risky. Well-capitalized operators with proven concepts and long time horizons benefit more from ownership, while capital-constrained first-time operators typically lease initially with potential purchase options as the business matures and proves viable.
Building Requirements: Infrastructure Essentials
Physical building characteristics determine which sites can practically accommodate activity park operations at reasonable cost. Critical infrastructure requirements include ceiling heights, floor load capacity, column spacing, mechanical systems, and emergency egress. Thorough evaluation during site selection avoids expensive surprises during design and construction when modification costs often prove prohibitive.
Ceiling height represents the most inflexible requirement, as increasing ceiling height after construction is typically impossible or ruinously expensive. Trampoline parks and facilities with climbing walls, drop slides, or ropes courses require minimum ceiling heights of five meters or sixteen feet, with six to seven meters preferred for advanced attractions. Inadequate ceiling height fundamentally limits attraction options, forcing concept compromises that weaken market positioning. Industrial warehouses and former big-box retail often provide superior ceiling heights compared to standard retail shells, making them preferred options despite potential needs for other infrastructure upgrades.
Floor load capacity determines whether the structure can support heavy equipment, concentrated weight from trampolines and climbing structures, and high-density crowds without structural reinforcement. Activity park equipment and occupancy create significant floor loading, particularly with trampolines requiring substantial frame weight and foam pits filled with thousands of foam cubes. Structural engineers should evaluate load capacity early, as reinforcement costs can be extreme or impossible depending on foundation and structural design. Ground-floor locations avoid floor loading constraints that plague second-story or elevated spaces, making them strongly preferred for equipment-intensive concepts.
Column spacing and layout flexibility affect traffic flow, sightlines, attraction placement, and overall design quality. Wide-open spans without interior columns allow optimal layout, clear parent sightlines to children, and efficient circulation. Dense column patterns force compromised layouts, create supervision blind spots, and waste space with inefficient attraction placement around structural elements. While columns can be incorporated into design through creative theming or strategic placement, open plans always provide superior flexibility and visitor experience.
HVAC capacity must handle high occupancy loads, active play heat generation, and climate control expectations. Activity parks fill with dozens or hundreds of people engaged in vigorous physical activity, generating substantial heat that inadequate cooling cannot manage. Uncomfortable temperatures shorten visits, reduce satisfaction, and create negative word-of-mouth. Existing HVAC systems in repurposed buildings often lack capacity for entertainment use, requiring expensive upgrades or supplemental systems. Electrical capacity must support comprehensive lighting, kitchen equipment, HVAC systems, arcade games, and technology infrastructure without constant circuit breaker trips or voltage drops that damage equipment.
Adequate restroom facilities scaled to peak occupancy prevent the miserable parent experience of long bathroom lines with impatient children. Building codes specify minimum fixture counts based on occupancy, but exceeding minimums improves satisfaction during peak periods. Family restrooms accommodate parents with opposite-gender children, while changing table availability in both men's and women's facilities reflects modern parenting realities. Water supply and drainage capacity must support kitchen operations, restroom usage, and cleaning without pressure drops or drainage backups that create sanitation issues.
Successful Location Strategies: Learning from the Market
Mixed-use entertainment districts exemplify successful location strategy by creating self-sustaining ecosystems where multiple uses reinforce each other. The Battery Atlanta, built around the Atlanta Braves stadium, integrates sports entertainment, restaurants, retail, offices, hotels, and residential towers in a walkable development that generates activity throughout the week. Residents provide built-in customer bases, office workers support weekday lunch traffic, and event attendees drive weekend crowds. Activity parks positioned within such districts benefit from constant foot traffic, affluent demographics, and positioning as integral lifestyle components rather than isolated destinations.
OCVibe in Anaheim follows similar principles, creating a mixed-use district around the Honda Center that combines sports, entertainment, dining, and residential uses. These developments demonstrate that location strategy extends beyond finding available space to positioning within broader lifestyle ecosystems. The entertainment district model reduces dependence on the park's own marketing by placing it within high-traffic areas where discovery happens organically. This strategic positioning commands premium rents but delivers superior traffic, demographics, and long-term stability compared to isolated locations.
Successful independent locations typically combine several strategic advantages: high-visibility sites on major thoroughfares, strong demographic matches within tight drive-time areas, proximity to complementary anchors like grocery stores or family entertainment, and communities with limited existing entertainment options. Parks that thrive in standalone locations often benefit from being first-movers in underserved markets, establishing brand recognition and customer loyalty before competitors enter. These pioneers capture market share, build community relationships, and achieve top-of-mind awareness that creates defensive moats even when subsequent competition emerges.
Failed location strategies often share common patterns: poor visibility requiring extensive marketing to generate awareness, difficult access creating visit friction despite interest, demographic mismatches between the concept and surrounding population, overestimating trade area size by ignoring drive-time realities and competitive interference. Learning from failures proves as valuable as studying successes, highlighting how even excellent operations cannot overcome fundamental location disadvantages. This reality makes location selection the most critical strategic decision, deserving extensive analysis, data-driven evaluation, and willingness to wait for the right opportunity rather than forcing suboptimal choices.
Summary Points
✓Location decisions represent long-term commitments that profoundly impact success, making systematic site selection essential to risk management.
✓Trade area analysis using drive-time modeling reveals realistic customer catchment, while gravity models and mobile location data predict actual visit probability.
✓Critical site selection criteria include demographic match, visibility and accessibility, adequate parking, zoning compatibility, and infrastructure capability.
✓Real estate formats span standalone facilities, repurposed retail, shopping centers, and mixed-use developments, each offering distinct strategic trade-offs.
✓Co-tenancy with complementary businesses amplifies success through synergistic traffic, with activity parks increasingly functioning as anchor tenants driving visits for entire retail districts.
✓Lease-versus-purchase decisions balance capital efficiency against long-term cost control and equity accumulation, with optimal choices depending on operator circumstances and market conditions.
Concept development transforms market insights and location opportunities into coherent, differentiated entertainment offerings that resonate with target audiences while supporting sustainable business models. A strong concept extends beyond simply selecting attractions and setting prices to crafting a comprehensive experience narrative that guides every design decision, operational choice, and marketing message. The concept answers fundamental strategic questions: Who is this park for? What problem does it solve? Why would families choose this over alternatives? What should it be known for? How does it differ from competitors? These questions demand clear, defensible answers before significant capital flows toward equipment procurement and construction.
Effective concepts balance multiple tensions simultaneously. They must appeal to children's emotional desire for fun while satisfying parents' rational evaluation of value, safety, and developmental benefit. They must differentiate from competitors while remaining operationally deliverable within budget and capability constraints. They must generate immediate trial through novelty and excitement while supporting repeat visits through depth, progression, and sustained engagement. They must scale to profitable capacity during peak periods while remaining financially viable during slower weekday and off-season operations. Navigating these tensions requires strategic clarity, market understanding, and willingness to make difficult trade-offs that focus the concept rather than diluting it through attempts to please everyone.
The concept development process integrates market research findings with competitive positioning analysis and brand strategy to create distinctive offerings. Demographics and psychographics identified during market research directly inform target age ranges, activity mix, and service priorities. Competitive analysis reveals positioning opportunities where unmet demand intersects with weak competitive response. Brand strategy establishes personality, values, and narrative that differentiate the park emotionally beyond functional attraction lists. Together, these elements cohere into a concept statement that articulates the park's essence, guides execution, and communicates value to customers.
Frameworks for Concept Development
Developing compelling concepts requires moving beyond transactional thinking to embrace branded entertainment principles where the brand becomes integral to the experience rather than simply a logo applied to generic offerings. This approach recognizes that memorable entertainment creates emotional connections through narrative, immersion, and identity rather than merely providing equipment and activities. Parks designed as branded entertainment destinations craft overarching themes or stories that infuse every element from physical design to staff behavior to marketing communications. The goal is creating worlds customers want to enter, belong to, and return to repeatedly.
Immersive storytelling provides the foundational framework, defining an overarching theme that shapes the entire guest experience. A space exploration theme, for example, transforms the ropes course into astronaut training, the ninja course into zero-gravity navigation, and the VR zone into alien world exploration. Staff become mission controllers, achievement badges become space patches, and progression systems track advancement through ranks from cadet to commander. This thematic coherence creates differentiation competitors cannot easily replicate without wholesale concept overhaul, while giving customers compelling narratives to share and identify with. Storytelling need not be heavy-handed or cartoonish; sophisticated execution integrates theme subtly through design elements, terminology, and touchpoints that reinforce the narrative without overwhelming the core activity.
Visual and atmospheric design translates concept into physical reality through intentional choices about color schemes, lighting, soundscapes, materials, and spatial composition. Every visual element should reinforce the intended brand personality and emotional tone. An adventure-focused concept might employ rugged materials, dramatic lighting, and energetic music that heighten adrenaline and excitement. A developmental concept targeting young children prioritizes soft colors, natural light, calming acoustics, and organized spaces that communicate safety and nurture. Visual design serves dual purposes: creating immediate emotional impact that attracts attention and drives trial, and crafting shareable moments that customers photograph and post organically, turning every visitor into a marketer.
Prioritizing shareability reflects the reality that modern customers, particularly younger demographics, evaluate experiences partly through the lens of how they will appear on social media. This does not mean designing for superficiality, but rather recognizing that visually distinctive, photogenic moments enhance perceived value while generating organic marketing reach. Strategic photo opportunities, dramatic design features, and aesthetically cohesive environments encourage user-generated content that extends brand awareness far beyond paid marketing budgets. Concepts that ignore this dynamic miss opportunities to leverage the most powerful marketing channel available: authentic customer enthusiasm shared through social networks.
Defining Target Audiences and Activity Mix
Precise target audience definition prevents the fatal error of trying to serve everyone, which typically results in serving no one particularly well. Age range decisions drive fundamental design choices about equipment selection, spatial allocation, safety protocols, supervision intensity, and service approach. Concepts must either focus tightly on specific age segments or deliberately layer offerings to serve multiple segments simultaneously with dedicated zones and appropriate transitions between them. The choice depends on market size, competitive landscape, available capital, and operator capability.
Concepts targeting families with young children ages zero to nine prioritize safe, enclosed, age-appropriate environments that support parental supervision while encouraging child independence. Soft play structures, sensory activities, low-height climbing equipment, and imaginative play elements dominate the attraction mix. High visibility from parent seating areas is non-negotiable, as parents of young children rarely feel comfortable when visual contact breaks. Service excellence emphasizes cleanliness, safety communication, staff warmth, and accommodation of the unpredictability that comes with young children. Successful execution in this segment builds trust that drives membership conversion, as parents with young children seek predictable, reliable, convenient recreation options they can incorporate into weekly routines.
Pre-teen concepts serving ages nine to twelve tap into the highest-growth segment by integrating edutainment elements that satisfy both child desire for challenge and parental desire for developmental value. This segment responds to progression systems that visibly track skill advancement, competitive elements that allow peer comparison without elimination-style failure, and activities that balance physical challenge with problem-solving and creativity. Ninja warrior courses, climbing walls with multiple difficulty routes, STEM workshops, and team challenges appeal strongly. Marketing to this segment requires dual messaging: exciting, social, challenging content that attracts children alongside developmental, safe, value-focused messaging that convinces parents.
Teen-focused concepts ages twelve to eighteen prioritize social interaction, adrenaline, competition, and cool factor over developmental framing. High-energy attractions like laser tag, competitive gaming, parkour, go-karting, and escape rooms drive excitement. Sophisticated aesthetics avoid juvenile theming that alienates image-conscious teens seeking venues that enhance rather than diminish social status. Staff must balance authority necessary for safety with approachability that earns respect rather than resentment. Successful teen concepts often incorporate evening or late-night hours when adult supervision feels less prominent, creating spaces where teens experience independence while parents trust the environment remains safe and supervised.
Multi-generational concepts attempt to serve broad age ranges by creating distinct zones for different segments while maintaining visual and thematic coherence across the entire facility. This approach maximizes addressable market and accommodates families with children spanning wide age ranges, but demands larger facilities, higher capital investment, more complex operations, and sophisticated design that prevents zones from feeling disconnected or haphazardly assembled. Successful multi-generational execution requires deliberate transitions between zones, clear wayfinding, and careful management of supervision expectations as children move between areas with different risk profiles and independence assumptions.
Activity mix balances anchor attractions that drive awareness and trial with supporting activities that extend dwell time and enhance satisfaction. Anchors are the hero attractions featured in marketing that create excitement and competitive differentiation: the massive climbing structure, the ninja warrior course, the multi-court trampoline area, the VR arena. Supporting activities add variety and options: arcade games, interactive projection walls, arts and crafts zones, quieter spaces for younger siblings or children needing sensory breaks. The mix should ensure every target customer finds compelling options while avoiding such breadth that capital scatters across too many mediocre offerings rather than concentrating on fewer excellent ones.
Positioning Strategies: Carving Out Competitive Space
Positioning defines how the park occupies mental space relative to competitors and alternative leisure options. Strong positioning answers the question that every potential customer consciously or unconsciously asks: Why should I choose this park over other ways to spend my time and money? Positioning operates across multiple dimensions including price, quality, target audience, benefit emphasis, and brand personality. The goal is establishing a clear, defensible position that resonates with a specific audience segment strongly enough to drive choice even when other options exist.
Price-based positioning ranges from value leadership to premium quality, with each approach demanding different operational execution and attracting different customer segments. Value positioning competes on affordability and accessibility, offering lower price points than competitors while maintaining acceptable quality and safety. This strategy attracts price-sensitive families, generates higher volume, and builds market share quickly. However, it demands operational efficiency, cost discipline, and typically lower profit margins while risking quality perception problems and difficulty defending against even lower-priced entrants. Value positioning works best in large markets with significant price-sensitive segments and when operators can achieve economies of scale through volume or multi-unit operations.
Premium positioning emphasizes superior quality, safety, service, and experience to justify higher pricing. This approach targets affluent demographics willing to pay more for demonstrably better offerings, positions the park as a special-occasion destination or aspirational membership, and enables higher margins despite lower volume. Premium execution demands excellence across all touchpoints: cutting-edge equipment, impeccable cleanliness, highly trained staff, sophisticated design, quality food and beverage, and attention to detail that justifies the price premium. Premium positioning insulates against price competition but requires sustained investment in quality and constrains market size to those able and willing to pay elevated prices.
Niche positioning targets specific underserved segments with specialized offerings that dominant players ignore or serve poorly. Examples include parks focused exclusively on early childhood development, facilities specializing in adaptive equipment for children with disabilities, venues emphasizing specific sports like parkour or rock climbing, or concepts built around particular themes like science exploration or creative arts. Niche strategies trade broad market appeal for depth of resonance with specific communities, often generating intense loyalty and word-of-mouth within target segments while remaining invisible to others. This approach works particularly well in competitive markets where generalist concepts saturate the mainstream, leaving specialized needs unmet.
Community hub positioning emphasizes social connection, local integration, and civic identity rather than competing primarily on attractions or price. This strategy positions the park as a gathering place woven into community fabric through school partnerships, local event hosting, nonprofit collaborations, and deliberate cultivation of regular member community. Parks adopting this positioning invest heavily in programming, community engagement, and creating spaces for parent interaction alongside child play. Success generates powerful loyalty and defensive positioning based on social embedding that competitors cannot easily replicate, though it requires long-term commitment and patience as community relationships develop slowly.
Brand Personality and Differentiation
Brand personality encompasses the human characteristics attributed to the park through design, messaging, staff behavior, and customer experience. Just as individuals have personalities that attract certain people while repelling others, park brands cultivate distinctive personalities that resonate strongly with target audiences. Personality transcends functional attributes to create emotional connections, facilitate identification, and generate advocacy among customers who feel the brand reflects their own values and identity.
Successful brand personalities demonstrate consistency, authenticity, and relevance to target audiences. A playful, energetic personality manifests through bright colors, upbeat music, enthusiastic staff, and marketing content emphasizing fun and excitement. An adventurous, challenging personality employs dramatic design, achievement-focused messaging, and staff who encourage pushing boundaries safely. A nurturing, developmental personality creates calm environments with natural materials, emphasizes learning and growth in communications, and trains staff to support children's emotional needs alongside physical activity. The chosen personality must align with target audience values while differentiating from competitor positioning.
Brand differentiation extends beyond personality to encompass distinctive elements that separate the park from alternatives in tangible ways. Unique or exclusive equipment unavailable at competitor locations creates immediate differentiation, though equipment advantages often prove temporary as competitors eventually access similar products. Service excellence offers more sustainable differentiation if embedded in culture and operations rather than dependent on individual star employees. Proprietary programming like specialized classes, unique events, or partnerships with recognized educational or athletic organizations creates differentiation that competitors cannot simply purchase. Technology integration through custom apps, gamification systems, or innovative attraction interfaces provides differentiation opportunities, particularly when technology enhances rather than replaces physical activity.
Thematic differentiation creates distinctive identity through consistent narrative execution that competitors cannot replicate without wholesale concept overhaul. While individual attractions might be similar to competitor offerings, the thematic wrapper and storytelling create unique positioning. A space exploration theme differentiated through mission-based achievements, astronaut training narratives, and cosmic visual design feels entirely different from a generic adventure park despite potentially similar underlying equipment. Thematic execution requires commitment and investment across all touchpoints but generates defensible differentiation that builds over time as customers develop emotional connections to the narrative and world being created.
Cultural and community differentiation emerges from authentic embedding within local communities through partnerships, programming, and values alignment. Parks that genuinely reflect and serve their communities develop loyalty based on identity and belonging rather than transactional attraction quality. This differentiation compounds over time as relationships deepen, social networks form, and the park becomes integral to family and community rhythms. Competitors opening nearby face not just equipment comparison but displacement of established relationships, habits, and community identity, creating substantial competitive moats for culturally embedded incumbents.
Concept Validation Before Investment
Concept validation reduces risk by testing core assumptions before committing major capital to construction and equipment. Validation methods range from secondary research analyzing analogous concepts to primary research directly testing the proposed concept with target customers. The validation process seeks to answer critical questions: Does the concept resonate emotionally with target audiences? Do parents perceive sufficient value to justify projected pricing? Which elements generate excitement versus indifference? What concerns or objections emerge? How does the concept compare to known alternatives in customer perception?
Survey research quantifies interest levels, pricing sensitivity, and feature preferences across statistically meaningful sample sizes. Online surveys distributed through social media, parenting groups, email lists, and local community channels gather data on likelihood to visit, acceptable price ranges, attraction preferences, and visit frequency intentions. Concept description should be clear but not oversell, presenting realistic representations that avoid generating artificially inflated interest. Survey design should test multiple price points, package structures, and feature combinations to identify optimal configurations. Response analysis reveals which demographic segments show strongest interest, what factors drive that interest, and where skepticism or concerns concentrate.
Focus groups provide qualitative depth that surveys cannot capture, revealing emotional reactions, language used to describe needs and concerns, and group dynamics that influence family entertainment decisions. Small groups of target customers review concept descriptions, view facility mockups or renderings, react to proposed names and branding, and discuss pricing options. Facilitated discussion probes beneath surface reactions to understand underlying motivations, fears, and decision criteria. Focus groups excel at uncovering unexpected objections that developers miss, identifying messaging that resonates versus language that falls flat, and generating insight into the customer evaluation process that guides marketing strategy.
Competitive benchmarking through visits to analogous concepts in non-competing markets provides empirical evidence of how similar concepts perform. Observing successful implementations reveals operational realities, customer behaviors, and design solutions that research alone cannot anticipate. Conversations with operators of similar concepts in different geographies often generate valuable insights about startup challenges, operational complexities, and market response. This benchmarking grounds optimistic projections in real-world performance data, helping developers distinguish sustainable concepts from trendy ideas that fail to generate repeat business.
Prototype or soft launch approaches test concepts with limited investment before full-scale commitment. Pop-up installations at community events, temporary locations in available retail space, or partnerships with existing venues to test specific attractions all provide validation through actual customer behavior rather than stated intentions. These approaches reveal whether interest translates to visits, whether pricing achieves targets, whether operations function as planned, and whether customers return. The learning justifies the cost and effort when it prevents expensive mistakes or validates concepts with confidence that accelerates full-scale development.
Learning from Successful Concepts
Successful entertainment brands across industries provide transferable lessons for activity park concept development. These brands demonstrate how to create emotional connections, build communities, leverage storytelling, and establish differentiation that transcends functional features. Studying these examples reveals principles applicable to activity park contexts even when the specific execution differs.
Nike exemplifies brand building through lifestyle positioning and aspirational identity rather than product features. Nike does not primarily sell shoes; it sells athletic achievement, personal determination, and the identity of being an athlete. The "Just Do It" ethos creates emotional resonance far beyond functional product benefits. Activity parks can adopt similar principles by positioning themselves not as places with equipment but as enablers of active lifestyles, family connection, and childhood development. Marketing shifts from listing attractions to telling stories of confidence built, friendships formed, and families bonded through shared experiences. This positioning elevates the park from commodity entertainment to meaningful lifestyle component.
Red Bull demonstrates brand extension through content creation and experiential marketing that builds entire ecosystems around core products. Red Bull owns and operates sports teams, produces media content, sponsors extreme athletes, and hosts events that embody brand values of adventure and peak performance. Activity parks can similarly extend beyond physical facilities through content creation showcasing member achievements, community events that bring the brand into broader community consciousness, partnerships with schools and sports organizations, and digital engagement that maintains connection between visits. This ecosystem approach transforms parks from isolated destinations into omnichannel presences integrated into customer lives.
The Lego Movie illustrates how brands can create entertainment properties that resonate authentically rather than feeling like extended advertisements. The film succeeded because it told genuinely compelling stories that happened to feature Lego, not because it showcased products. Activity parks can apply this principle by creating experiences and programs that deliver intrinsic value and enjoyment while naturally featuring the park as the setting. Birthday parties become celebrations of childhood milestones, achievement programs track genuine skill development, community events create authentic gathering opportunities. When programming delivers real value, the commercial relationship feels secondary to the authentic benefit, building trust and loyalty.
Duolingo demonstrates how social media savvy and personality-driven content can generate viral awareness and cultural relevance far exceeding paid marketing budgets. The language learning app created a distinctive brand voice through humorous, self-aware social media presence that embraced internet culture and engaged authentically with users. Activity parks can similarly develop distinctive voices and personalities in digital channels, creating content that entertains and engages rather than merely promoting. User-generated content encouraged through shareable moments and community features transforms customers into brand ambassadors who extend reach organically. This approach requires authenticity and consistency rather than large budgets, making it accessible even to independent operators.
These successful brands share common principles: they create emotional connections beyond functional benefits, they build communities and belonging rather than transactional relationships, they tell authentic stories that resonate with audience values, they maintain consistency across all touchpoints, and they position themselves as integral to customer lifestyles and identities rather than occasional purchases. Activity parks applying these principles transcend equipment-focused competition to build brand equity, loyalty, and defensive positioning that sustain profitability through market changes and competitive pressure.
Summary Points
✓Concept development transforms market insights into coherent, differentiated offerings by answering fundamental questions about target audience, value proposition, and competitive positioning.
✓Strong concepts employ branded entertainment principles that create immersive narratives, distinctive personalities, and emotional connections transcending functional attraction lists.
✓Target audience definition drives activity mix decisions that either focus tightly on specific age segments or deliberately layer offerings for multi-generational appeal.
✓Positioning strategies range from value leadership to premium quality to niche specialization to community hub.
✓Brand personality and differentiation establish distinctive identity through consistent expression of human characteristics that resonate emotionally with target audiences.
✓Concept validation using surveys, focus groups, competitive benchmarking, and prototype testing reduces risk by confirming assumptions before major capital commitment.
PART IV:
DESIGNING THE EXPERIENCE
Part IV moves from strategy to the physical experience guests will remember. It covers the spatial discipline of zoning and guest flow, the strategic selection of activities and equipment, and the non-negotiable commitment to safety and risk management that underwrites the entire business. Design choices in these chapters directly determine revenue per square foot, operating cost, and brand reputation. Operators who treat experience design as a serious craft rather than an afterthought consistently outperform peers on nearly every financial and customer metric.
The physical environment of an activity park shapes everything that happens within its walls. Layout decisions determine whether guests navigate intuitively or become confused, whether parents feel comfortable enough to relax or remain anxious, and whether operational teams can deliver efficient service or struggle with bottlenecks and chaos. The strategic arrangement of spaces, attractions, and circulation paths directly influences revenue per square meter, staff productivity, incident rates, and customer satisfaction scores. Effective spatial design is not merely aesthetic—it is a fundamental business driver that affects every metric from first-visit conversion to membership renewal rates.
Many operators approach layout as an afterthought, focusing first on equipment selection and then attempting to arrange those pieces within available space. This backward approach typically results in compromised experiences, operational inefficiencies, and costly retrofits. The correct sequence begins with understanding the ideal guest journey, then designing zones and circulation to support that experience, and only then selecting equipment that fits within the strategic spatial framework. This chapter provides the principles, frameworks, and practical considerations needed to create layouts that enhance both the guest experience and operational performance.
Spatial design influences business outcomes across multiple dimensions simultaneously. A well-designed layout maximizes revenue per square meter by ensuring high-value attractions occupy premium locations while supporting functions use less expensive peripheral areas. Operational efficiency improves when staff can monitor multiple zones from strategic positions, when service areas connect logically to minimize unnecessary movement, and when capacity constraints are designed into the flow rather than discovered during peak periods. Safety performance depends heavily on sightlines, separation of conflicting uses, and circulation patterns that prevent congestion and collisions. Customer satisfaction increases when navigation feels effortless, when parents can supervise comfortably, and when the environment appears thoughtfully designed rather than haphazardly assembled.
Layout Design Principles
Before placing a single piece of equipment, operators must define what the facility should accomplish for guests. The layout should tell a coherent story, guiding families naturally from arrival through active play to departure, with each transition feeling logical and effortless. This begins with articulating a clear purpose and vision for the park. A trampoline-focused adventure park will organize space very differently than a developmental play center emphasizing quiet learning zones. The vision informs decisions about which areas receive prime real estate, how much space is allocated to different functions, and what emotional tone each zone should convey.
Intuitive navigation stands as perhaps the single most important design principle. Guests should be able to orient themselves immediately upon entry, understanding where activities are located, where restrooms can be found, and how to access food service without asking staff for directions. This intuitive quality emerges from clear sightlines that allow guests to see into different zones from central vantage points, logical pathways that follow natural movement patterns, and visible landmarks that serve as wayfinding anchors. When families must search for basic amenities or cannot find attractions they know exist, frustration accumulates and perceived value declines. The layout itself should communicate the park's organization clearly and immediately.
The entry sequence deserves particular attention because it establishes first impressions and sets expectations for the entire visit. Upon entering, guests should encounter a welcoming reception area that efficiently handles ticketing and waivers while building excitement for what lies ahead. Visual previews of key attractions—perhaps visible through windows or openings—generate anticipation and help orient families to the layout. The transition from entry to play should feel gradual rather than abrupt, allowing guests to store belongings, complete safety orientations, and mentally prepare for activity. Rushing families directly from the front door into chaotic play areas creates disorientation and anxiety, particularly for first-time visitors and parents of young children.
The reception area should be designed to handle peak capacity without creating bottlenecks that delay entry and frustrate arriving guests. Multiple check-in stations, self-service kiosks for members with pre-purchased access, and separate lines for parties versus general admission all improve flow during busy periods. The physical space should accommodate waiting families comfortably, with adequate seating for those completing waivers or waiting for others in their group. Storage for shoes and belongings must be convenient and visible from the check-in area, preventing confusion about where items should go. The reception desk should be positioned to allow staff to see both the entrance and key areas of the facility, enabling them to monitor arrivals, watch for departures, and observe any issues requiring attention.
Exit sequences matter equally but receive far less attention from most operators. The departure path should guide guests past strategic revenue opportunities—retail displays, upcoming event promotions, membership sign-up stations—without feeling forced or manipulative. Families leaving with positive final impressions, perhaps after a smooth checkout process or a friendly goodbye from staff, are far more likely to return than those whose last experience involves long waits, difficulty locating exits, or abrupt transitions from play to parking lot. The exit should feel like a natural conclusion to a well-designed journey rather than an afterthought. Some parks install photo displays near exits showing memorable moments from the day's play, which creates positive emotional closure while encouraging social media sharing and purchase of photo packages.
Zoning Strategy
Zoning divides the park into distinct areas organized by function, age appropriateness, or activity intensity. This organization serves multiple business objectives simultaneously: it manages guest flow to prevent bottlenecks, ensures activities are developmentally appropriate for users, enhances safety by separating conflicting uses, and allows targeted marketing of different zones to different customer segments. The most fundamental zoning principle involves age segmentation, creating dedicated spaces for toddlers, preschoolers, school-age children, and teenagers that reflect the developmental needs and physical capabilities of each group.
Toddler zones require special consideration because parents of young children evaluate parks primarily through the lens of safety and age appropriateness. These areas must be physically separated from high-energy zones where older children run, jump, and collide. Low-height equipment, soft surfaces, sensory elements, and enclosed boundaries create environments where toddlers can explore safely while parents maintain visual supervision from comfortable seating positioned immediately adjacent. The physical separation is not merely about preventing collisions; it creates a psychological comfort zone where parents of young children feel the park was designed specifically for their family rather than as an afterthought to teen attractions.
The ideal toddler zone includes multiple activity types that support different aspects of development. Soft climbing structures with gentle inclines and low platforms build gross motor skills without intimidating fall heights. Ball pits with oversized balls that cannot be swallowed encourage tactile exploration and movement. Interactive panels with textures, mirrors, spinners, and simple mechanisms develop fine motor skills and cognitive understanding. Low slides provide the thrill of movement with minimal risk. Enclosed spaces like crawl-through tunnels satisfy the toddler desire for exploration while keeping children contained and visible. The zone should be sized appropriately for the target market—undersized toddler areas disappoint parents who find them crowded or limited, while oversized spaces feel empty and fail to justify the footprint.
School-age zones typically occupy the largest footprint because this demographic drives the highest volume and frequency of visits. These areas can accommodate higher-intensity activities like trampoline courts, climbing walls, ninja courses, and competitive games. The key design challenge involves balancing capacity with safety, ensuring sufficient space for peak occupancy without creating emptiness during slower periods. Equipment placement should encourage natural circulation, prevent crowding at popular attractions, and allow staff to monitor multiple activity stations from strategic positions. Grouping similar activity types—all climbing attractions in one zone, all trampoline courts in another—helps with staffing efficiency and creates clear themed areas that aid navigation.
Within school-age zones, further subdivision by skill level or activity intensity often proves valuable. Beginner-friendly attractions positioned near the zone entrance allow children to build confidence before progressing to more challenging elements deeper in the space. This progressive difficulty creates a natural journey of increasing challenge and accomplishment. Clear visual differentiation between beginner and advanced areas helps children self-select appropriate activities while creating aspirational goals visible to those still building skills. Some parks use color coding or theming to distinguish different difficulty levels, making the progression obvious without requiring extensive signage or explanation.
Teen and advanced zones serve a specialized but valuable market segment. Teenagers will not visit parks that feel oriented exclusively toward young children, but they represent significant revenue potential through memberships, drop-in visits, and group events. These zones should feel distinct from the main family areas, perhaps located in a separate section with more sophisticated aesthetics, higher-difficulty challenges, and social spaces where teens can interact with peers. The equipment should test genuine athletic ability—advanced climbing routes, complex ninja obstacles, competitive elements—creating an environment where teenagers feel challenged rather than condescended to. Many successful parks position teen zones as premium or unlockable areas, requiring membership or skill demonstration, which adds aspirational value.
Activity-based zoning provides an alternative or complement to age-based organization. Grouping all jumping activities together, all climbing elements in another zone, all interactive technology in a third area creates clear thematic spaces that appeal to interest rather than age. This approach works particularly well for parks targeting older children and teens who resist age-based categorization. The trade-off involves less natural age separation, requiring more active supervision to prevent developmental mismatches. Many parks combine both approaches, using age-based zones for the youngest children while organizing older-kid areas by activity type.
Circulation and Traffic Flow
Traffic flow management determines how efficiently a park can handle capacity, how comfortable the experience feels during busy periods, and how effectively staff can monitor safety and service. Main circulation paths should be immediately obvious, wide enough to accommodate peak traffic without congestion, and free of obstacles that force guests to navigate around equipment or furniture. A common mistake involves maximizing play equipment at the expense of circulation space, creating an environment that feels cramped and chaotic even at moderate occupancy levels. Generous pathways not only improve guest comfort but also facilitate emergency egress, equipment maintenance, and operational flexibility.
The width of primary circulation paths should be determined by peak occupancy expectations rather than typical usage. Pathways serving as main arteries between major zones should be wide enough for multiple families to pass comfortably, accounting for adults carrying toddlers, children moving quickly between activities, and the reality that some guests will pause in pathways rather than moving to designated areas. A minimum width of two meters for main circulation paths works for smaller facilities, while larger parks may require three meters or more to prevent congestion. Secondary paths connecting to individual attractions can be narrower but should still accommodate two-way traffic comfortably.
The relationship between active play zones and parent observation areas requires particular attention. Parents need comfortable seating with clear sightlines to all areas where their children might play. This means avoiding tall barriers, positioning seating at appropriate heights and angles, and ensuring adequate lighting throughout play zones. When parents cannot see their children, two problems emerge: anxiety drives parents to hover within play areas rather than relaxing in designated seating, and children receive less supervision because parents cannot monitor from a distance. The ideal layout allows parents to sit comfortably with coffee and conversation while maintaining visual contact with active play areas.
Seating arrangement influences both parent comfort and social interaction opportunities. Individual chairs allow flexibility but discourage conversation and community building. Bench seating promotes social interaction but lacks individual comfort. Many successful parks use a mix: individual comfortable chairs for those preferring privacy or working, plus communal tables and bench seating for parents who enjoy socializing with others. Positioning seating in small clusters rather than long rows creates more intimate social spaces while maintaining sight lines to play areas. The quantity of seating should accommodate peak capacity with margin; insufficient seating forces parents to stand or crowd into uncomfortable positions.
Queue management often receives insufficient attention during initial design, leading to frustration during peak periods when popular attractions develop waiting lines. High-demand attractions should include defined queuing space that keeps waiting guests organized without blocking circulation paths or other activities. Some parks implement timed entry systems or reservation approaches for capacity-limited attractions, which requires designated waiting areas and clear communication systems. The physical layout should accommodate these operational needs without retrofitting temporary barriers or signage that appear chaotic and unprofessional. Digital displays showing current wait times help manage expectations and allow guests to make informed decisions about which activities to pursue.
Food and beverage areas represent crucial revenue centers that must be positioned strategically within the circulation system. The café should be easily accessible from play areas but somewhat separated to prevent food and drinks from migrating into active zones where they create safety hazards. Many successful layouts position the café as a central hub with visibility to multiple play zones, allowing parents to grab refreshments while maintaining supervision. The café entrance should be obvious and inviting, with menu boards visible from a distance and seating that feels comfortable rather than utilitarian. When food service feels like an integrated part of the experience rather than an afterthought, per-capita spending increases significantly.
The café layout itself requires careful planning to prevent bottlenecks and maximize throughput. Separate ordering and pickup stations reduce congestion at the counter. Clear queuing areas keep waiting customers organized. Self-service stations for condiments, napkins, and utensils prevent counter crowding. The kitchen should be sized for peak demand rather than average usage, with equipment and workflow designed to handle simultaneous party orders, individual purchases, and advance catering preparation. Back-of-house storage for dry goods, refrigerated items, and supplies must be adequate to prevent mid-shift restocking that disrupts service. Access for deliveries should be separate from customer areas to maintain operational flow.
Sightlines and Supervision
Sightlines serve dual purposes: they enable parents to supervise children from comfortable positions, and they allow staff to monitor multiple zones efficiently. The layout should be designed so that parents sitting in designated seating areas have unobstructed views of the play zones their children are using. This requires careful attention to the height and placement of equipment, walls, and partitions. Tall structures that block sightlines should be positioned around perimeters rather than in central locations, and semi-transparent materials like mesh or netting should be used where full walls would obstruct visibility.
Parent sightlines matter psychologically as much as practically. When parents can see their children easily, they relax and engage more naturally in social conversation, work, or personal activities. This relaxation extends visit duration because parents feel comfortable staying longer. They also spend more on food and beverages when settled comfortably rather than anxiously monitoring. Conversely, when parents cannot see children clearly, they hover anxiously in play areas, interrupt activities to check on kids repeatedly, or cut visits short due to stress. The difference in visit duration and spending between parks with excellent sightlines versus poor visibility can be substantial—often thirty minutes or more in average visit length, which translates directly to food and beverage revenue.
Staff supervision zones should be integrated into the layout design rather than determined after equipment installation. High-risk attractions like trampoline courts, climbing walls, and ninja courses require dedicated staff positions with clear views of all activity. These monitoring positions should be elevated slightly to improve sightlines, positioned to minimize blind spots, and located to allow quick response to incidents. Many parks install elevated platforms or designated stations for safety monitors, clearly marking these positions and ensuring staff understand their purpose. When supervision requirements are considered during layout planning rather than after opening, both safety performance and labor efficiency improve substantially.
The number and positioning of staff supervision stations directly affects labor costs and safety outcomes. Layouts requiring many isolated supervision positions demand higher staffing levels and increase labor costs. Designing zones so that one staff member can monitor multiple related attractions from a central position reduces staffing requirements without compromising safety. This requires positioning equipment to create clear supervision zones with minimal blind spots, using mirrors or camera systems to extend visibility where physical sightlines cannot reach, and accepting some constraints on equipment placement to optimize supervision efficiency. The labor cost savings from efficient supervision design often exceed the minor compromises in equipment arrangement.
Safety Buffers and Use Zones
Every piece of playground equipment has a defined use zone—the surface area where a user might land when falling from or exiting the equipment. These zones must be covered with impact-attenuating materials, kept free of obstacles, and designed to prevent overlap with adjacent equipment use zones. Regulatory standards provide specific dimensions based on equipment height and type, but operators should view these as minimums rather than targets. More generous safety buffers improve both actual safety and perceived safety, which matters greatly to parents evaluating whether to trust the facility with their children.
Use zone calculations depend on the type of equipment and its fall height—the vertical distance between the highest designated play surface and the protective surfacing below. For stationary equipment like climbing structures, use zones typically extend six feet beyond the perimeter of the equipment, or farther for taller structures. Swings and other equipment with moving components require larger use zones to account for the arc of motion. Slides need clear runout areas at the bottom where children exit at speed. The specific requirements are detailed in standards documents and should be verified for each piece of equipment during design. Attempting to minimize use zones to maximize equipment density creates both safety hazards and liability exposure.
Padding systems for structural elements within play zones—posts, beams, walls, edges—must be integrated into the design from the beginning rather than added reactively after noticing collision risks. All hard surfaces within reach of active play should be covered with thick, shock-absorbing padding in colors and styles that integrate with the overall aesthetic. Padding should not look like an afterthought or a band-aid solution; it should appear as an intentional design element. The quality and completeness of padding systems communicate professionalism and care to parents, directly influencing their trust in the facility.
Padding specifications matter significantly for both protection and durability. Commercial-grade padding designed specifically for activity parks typically features high-density foam cores that maintain shock absorption through years of impact, vinyl or similar covers rated for commercial cleaning products and resistant to tears and punctures, and attachment systems that prevent padding from shifting or falling off under normal use. The thickness of padding should be appropriate to the collision risk—higher-speed areas like trampoline court perimeters require thicker padding than low-speed zones. Color selection should account for visible wear patterns; darker colors or patterns hide dirt better than bright solid colors that show every mark.
Emergency egress paths must remain clear and obvious at all times, meeting local fire codes and safety regulations without exception. Exit routes should be marked clearly with illuminated signage, kept free of any equipment or furniture that could impede rapid evacuation, and designed to prevent bottlenecks even at maximum occupancy. The layout should include multiple egress options from all major zones, with exit doors clearly visible and easy to locate even for first-time visitors or young children. Regular inspections should verify that egress paths remain clear and that staff understand evacuation procedures specific to the layout. Many facilities paint floor markings or use different flooring materials to designate emergency egress routes, making them obvious even when the space is crowded or visibility is reduced.
Parent Amenities
Parents represent half of the dual-loyalty equation, and their comfort directly influences visit frequency and duration. Seating areas should offer genuine comfort through quality furniture, adequate quantity to accommodate peak periods, and placement that balances supervision requirements with social interaction opportunities. Parents appreciate areas where they can converse with other adults while children play independently, creating natural community-building opportunities that strengthen loyalty. Insufficient or uncomfortable seating forces parents to stand or hover anxiously, reducing their satisfaction and shortening visit duration.
Furniture selection should prioritize actual comfort over cost minimization. Padded chairs rather than hard plastic seating, tables at comfortable heights for working or eating, and ergonomic designs that support extended sitting all contribute to parent satisfaction. Some parks create different seating zones serving different needs: lounge-style seating with sofas and coffee tables for relaxed socializing, café-style tables and chairs for eating and working, bar-height counters with stools for individual parents who want to work while watching children. This variety accommodates different parent preferences and occasions, increasing the likelihood that the facility meets needs on any given visit.
Restroom facilities must be sized appropriately for peak occupancy, maintained immaculately, and positioned conveniently without requiring long walks from play areas. Family restrooms with changing tables serve parents of young children, while standard facilities should be clean, well-stocked, and checked frequently throughout operating hours. Restroom quality and cleanliness rank among the top factors parents mention in reviews, making these facilities far more important to business success than many operators realize. The layout should position restrooms centrally and make them easy to find through clear signage and visibility. Providing more restroom capacity than minimum code requirements prevents lines during peak periods and demonstrates commitment to customer comfort.
Changing areas for young children should include private, clean spaces with proper changing tables, disposal systems for diapers, and hand washing facilities. Many parks now provide nursing rooms or privacy areas for mothers breastfeeding, which appeals strongly to parents of infants and toddlers. These spaces should be comfortable, private, and equipped with seating, surfaces for bottles or bags, and appropriate lighting. While not legally required in most jurisdictions, these amenities differentiate facilities competing for families with very young children and demonstrate thoughtfulness about diverse family needs.
Wi-Fi access, charging stations, and work-friendly spaces cater to modern parent expectations. Some parents appreciate the opportunity to catch up on work or email while children play, and providing these amenities extends visit duration while improving the parent experience. Dedicated areas with tables, power outlets, and strong Wi-Fi signal create productive spaces that differentiate the park from competitors who offer only basic seating. These amenities particularly attract parents working flexible schedules who might visit during weekday mornings or afternoons when other facilities are empty. The incremental cost of providing quality Wi-Fi and power outlets is minimal relative to the value created for this customer segment.
ADA Compliance and Inclusive Design
Accessibility compliance is both a legal requirement and a business opportunity. Facilities must provide accessible routes throughout the park, ensuring that individuals using wheelchairs or other mobility devices can navigate all public areas. This includes accessible parking, entrance ramps or lifts, wide corridors, accessible restrooms, and play components that children with disabilities can use. Compliance involves detailed specifications for door widths, ramp slopes, turning radii, and reach ranges, all of which should be addressed during initial design rather than through expensive retrofits after construction.
The Americans with Disabilities Act and similar legislation in other countries mandate specific technical requirements for accessibility. Accessible routes must be at least thirty-six inches wide with adequate passing space, have slopes no greater than 1:12 for ramps, include tactile warnings at elevation changes, and provide adequate maneuvering clearance at doors and transitions. Restrooms must include accessible stalls with proper dimensions, grab bars, and sink heights. Service counters require accessible portions at appropriate heights. Play areas must provide accessible routes to various play components, with a specific percentage of equipment usable by children with disabilities. These requirements are legally mandated and subject to inspection and enforcement.
Inclusive design goes beyond minimum compliance to create experiences genuinely welcoming to families with children who have disabilities. This might include sensory-friendly zones with controlled lighting and sound for children with autism, equipment designed for wheelchair users or children with limited mobility, quiet spaces for children who become overwhelmed, and staff trained in disability awareness and assistance. Some parks offer dedicated sensory-friendly hours with reduced sound and lighting, which builds strong loyalty among families who struggle to find appropriate recreation options. The layout should accommodate these inclusive features naturally rather than segregating adaptive equipment into separate, stigmatizing areas.
The business case for inclusive design extends beyond legal compliance. Families with children who have disabilities represent an underserved market segment that demonstrates exceptional loyalty to facilities meeting their needs. These families often struggle to find appropriate recreational options and become devoted customers when discovering welcoming environments. They generate strong word-of-mouth referrals within disability communities and advocacy networks. Inclusive features also benefit children without disabilities—sensory elements, quiet zones, and varied equipment types enhance the experience for all guests. Marketing the facility as inclusive and accessible attracts socially conscious families who value diversity and community.
Capacity Planning and Density Management
The layout must be designed around maximum capacity targets that balance revenue optimization with experience quality and safety. Overcrowding degrades the experience, increases incident risk, and creates negative reviews that damage long-term business prospects. Undercapacity leaves revenue on the table and makes the facility feel empty during slower periods. The optimal capacity depends on facility size, attraction types, target demographics, and competitive positioning. Premium-positioned parks typically operate at lower density to maintain experience quality, while value-oriented facilities may accept higher density to maximize throughput and revenue.
Calculating appropriate capacity requires considering multiple factors simultaneously. Total square footage provides a starting point, with industry rules of thumb suggesting occupancy factors around one person per certain number of square meters depending on facility type. However, usable play space matters more than total area—back-of-house space, restrooms, circulation paths, and party rooms don't contribute to capacity. Individual attraction capacities create bottlenecks; even if total space could theoretically accommodate five hundred people, constraints on popular attractions may create crowding or queuing that degrades experience at much lower occupancy. The layout should identify these potential bottlenecks during design and either expand constrained attractions or implement access management systems.
Different zones may have different density tolerances based on activity type and safety requirements. Trampoline courts typically limit users per trampoline to prevent collisions and injuries, meaning capacity is determined by number of trampolines rather than total area. Soft play structures can accommodate higher density safely. Climbing walls have inherent capacity limits based on number of routes and auto-belay devices. The overall facility capacity should reflect the sum of zone-specific limits rather than generic space calculations. This zone-by-zone analysis often reveals that certain attraction types create capacity constraints requiring expansion or alternatives during design.
Summary Points
✓Spatial design determines operational efficiency, safety performance, and revenue generation as much as equipment selection or marketing strategy.
✓The layout should be designed around the ideal guest journey, creating intuitive navigation, clear sightlines, appropriate zoning, and generous circulation paths.
✓Age-based zoning ensures developmental appropriateness while managing safety risks and targeting different market segments.
✓Parent amenities, comfortable seating, convenient restrooms, food service, Wi-Fi, directly influence visit duration and satisfaction among the decision-makers who control spending.
✓Safety buffers, use zones, and egress paths must comply with regulatory standards while communicating professionalism and care to parents.
✓Sightlines enable both parent supervision and staff monitoring, reducing both actual risk and parental anxiety.
The attraction portfolio defines what the park is, determines who visits, and shapes competitive positioning more powerfully than any other single factor. Equipment decisions commit substantial capital, influence operational costs for years, and create either flexible or rigid constraints on future evolution. A thoughtfully designed activity mix attracts broad demographics, supports diverse revenue streams, enables repeat visitation, and differentiates the park from competitors. Conversely, poorly chosen equipment leads to underutilized space, narrow appeal, rapid guest boredom, and expensive replacement cycles when operators attempt to correct initial mistakes.
Many operators approach equipment selection by visiting competitor facilities, identifying popular attractions, and attempting to replicate those elements. This copycat strategy typically results in undifferentiated offerings that compete solely on price and location rather than unique value. The superior approach begins with strategic questions about target demographics, desired positioning, revenue model, and operational capabilities before evaluating specific equipment options. This chapter provides frameworks for developing an effective activity mix, criteria for evaluating specific attractions, and guidance for working with equipment suppliers.
Equipment represents the largest single capital expense in most park developments, typically consuming thirty to forty percent of total project budgets. A three-thousand square meter facility might invest four hundred thousand to eight hundred thousand dollars in attractions alone. These investments must generate returns over five to ten years through attracting visitors, supporting premium pricing, enabling repeat visits, and requiring minimal ongoing maintenance costs. Equipment that fails to deliver on these objectives becomes a permanent constraint on business performance, while superior selections create sustainable competitive advantages that drive profitability for years.
Age Segmentation and Developmental Appropriateness
Different age groups require fundamentally different types of play experiences based on their developmental stage, physical capabilities, and social patterns. Toddlers aged zero to three need sensory-rich environments with soft, low-height structures that support exploration without significant fall risk. Appropriate equipment includes padded play structures with tunnels and slides no higher than one meter, ball pits with large, soft balls that cannot be swallowed, textured surfaces and interactive panels that stimulate tactile development, and enclosed areas where parents can supervise easily while toddlers explore independently at their own pace.
The toddler equipment market offers enormous variety in quality, safety, and developmental appropriateness. Superior toddler structures incorporate developmental research into their design, providing varied textures for sensory stimulation, appropriate challenge levels that build confidence without inducing fear, interactive elements like simple gears or spinning components that develop cause-and-effect understanding, and thoughtful color schemes that are visually engaging without being overstimulating. The structure should encourage movement and exploration while providing rest areas where toddlers can pause and process. Inadequate toddler equipment often consists simply of scaled-down versions of older-kid attractions without consideration of developmental differences, which leads to limited engagement and rapid boredom.
Preschool children aged three to six are developing gross motor skills, beginning to engage in cooperative play, and building confidence through manageable challenges. Equipment for this age group should encourage climbing, balancing, sliding, and imaginative play through structures that offer moderate challenges without intimidation. Multi-level soft play structures with varied routes, small climbing walls with easy holds and minimal height, simple obstacle courses that children can navigate independently, and themed play elements that spark imaginative scenarios all serve this demographic well. The equipment should support both independent exploration and peer interaction without requiring adult participation.
Preschool equipment should incorporate choice and variety to maintain engagement across multiple visits. A quality soft play structure offers multiple paths to the same destination, allowing children to select their preferred challenge level and vary their route on different visits. Interactive elements like steering wheels, windows, and themed components support imaginative play that creates different narratives each time. The structure should be complex enough to prevent complete mastery in a single visit while accessible enough that most children can successfully navigate core components independently. Equipment that children master completely in one visit offers little incentive to return, while attractions that remain perpetually out of reach create frustration rather than engagement.
School-age children from six to twelve represent the core demographic for most activity parks, driving the highest visit frequency and revenue. This group seeks physical challenges that test developing athletic abilities, social activities that allow interaction with peers, competitive elements that provide status and achievement, and opportunities to build genuine skills that create pride and mastery. Trampoline courts, climbing walls with multiple route difficulties, ninja warrior courses with progressive obstacles, dodgeball and sports courts, foam pits for practicing aerial maneuvers, and interactive gaming elements that combine physical and mental challenges all appeal strongly to this age range. The equipment mix should include both accessible entry points for beginners and advanced challenges that maintain engagement as children develop skills.
Equipment for school-age children should explicitly support skill progression and mastery experiences. Climbing walls with routes of varied difficulty allow beginners to build confidence on easy climbs while advanced users tackle challenging overhangs and technical sequences. Ninja courses that offer alternative paths around difficult obstacles accommodate mixed skill levels simultaneously. Trampolines support progression from basic jumping to flips and aerial maneuvers. This progressive difficulty creates ongoing engagement because children always have new challenges to pursue. Parks that track and celebrate progression—through achievement systems, visible progress displays, or recognition programs—reinforce the mastery experience and build stronger loyalty.
Teenagers and young adults require attractions that feel distinct from child-oriented activities, offering legitimate athletic challenges, social credibility, and achievement opportunities. This demographic responds well to advanced ninja courses with obstacles requiring significant strength and technique, parkour and free-running zones, competitive elements with performance tracking and leaderboards, high-difficulty climbing routes, aerial attractions with genuine height and complexity, and equipment that supports trick progression and skill mastery. The aesthetic and positioning of teen zones matter as much as the equipment itself; teenagers will not engage with attractions that appear childish regardless of actual difficulty. Many parks position these areas as premium or exclusive zones, requiring membership or achievement unlocks, which enhances their appeal through status differentiation.
Teen attraction design should incorporate social and competitive elements that align with adolescent developmental priorities. Performance tracking systems that display personal bests, leaderboards showing top performers, and comparative challenges where friends compete against each other all resonate with teen psychology. The space should facilitate peer interaction through spectator areas where groups can watch and encourage each other, equipment designed to accommodate multiple simultaneous users, and social media integration that allows sharing achievements. Teens are far less motivated by parental approval than younger children; their engagement depends on peer status, personal challenge, and social connection opportunities within the attraction design.
Balancing Novelty and Repeatability
The tension between novelty and repeatability represents one of the most critical equipment selection challenges. Novel attractions generate initial excitement, drive word-of-mouth marketing, and create memorable first impressions that convert trial visitors into members. However, attractions that deliver identical experiences on every visit quickly become boring, leading to rapid guest churn despite strong initial interest. The most valuable equipment delivers variable experiences through skill progression, changing content, social dynamics, or competitive elements that make each visit feel fresh despite using the same physical infrastructure.
Trampoline courts exemplify high repeatability because the experience varies based on user skill, social interaction, and self-directed activity choices. Beginners focus on basic jumping and building comfort, intermediate users practice tricks and aerial maneuvers, advanced users attempt complex combinations and competitive challenges, and all skill levels can engage simultaneously without the attraction feeling stale. The physical infrastructure remains constant but the experience evolves with user development. This inherent variability explains why trampoline parks can build sustainable membership models while one-time novelty attractions struggle with retention.
Climbing walls similarly support progression as users tackle increasingly difficult routes, master new techniques, and build strength and confidence over dozens of visits. The key is ensuring sufficient route variety and regular route changes to prevent complete mastery. Parks that reset climbing routes quarterly, maintain extensive route libraries covering various difficulty grades, and design walls with varied angles and features create ongoing challenges for committed users. The marginal cost of route setting is minimal compared to the retention value created, making regular route updates one of the highest-return investments available to climbing-focused facilities.
Interactive technology enables physical equipment to deliver changing experiences through digital overlays, missions, and adaptive content. Interactive climbing walls that project targets, games, or challenges onto the surface transform a static structure into an ever-changing experience. Floor projection systems on trampoline courts create varied games and competitions using the same physical infrastructure. Ninja courses with performance tracking, achievement systems, and progressive challenges maintain engagement through digital progression even when physical equipment remains constant. This technology integration requires higher initial investment but dramatically improves repeatability and provides data for personalization and marketing.
The return on investment for interactive technology depends on implementation quality and content strategy. Systems that launch with limited content and never update quickly become stale, providing little advantage over static equipment. Successful implementations include regular content updates, seasonal variations, special event programming, and responsive adaptation to user preferences. The technology should enhance rather than replace physical activity; attractions that become primarily screen-based lose the developmental and health positioning that differentiates activity parks from video arcades. The ideal integration makes physical activity more engaging and varied through digital enhancement while maintaining emphasis on movement and skill development.
Modular and reconfigurable equipment offers another approach to maintaining freshness. Obstacle courses that can be rearranged periodically, ninja warrior elements that can be swapped or replaced, interactive game stations with regularly updated content, and seasonal or themed installations that change quarterly all keep the environment feeling dynamic. This flexibility requires designing for modularity from the beginning, ensuring adequate storage for rotated elements, and committing to regular refreshes rather than static installations. Parks that successfully implement modular strategies maintain higher visit frequency because members perceive continuing novelty.
The operational commitment required for modularity should not be underestimated. Rotating configurations requires staff time for disassembly, storage, reconfiguration, and safety inspection of new layouts. Storage space must be allocated for elements not currently in use. Some configurations may require professional installation or certification before reopening. The business case for modularity depends on whether the increased retention and visit frequency justify these ongoing operational costs. For some facilities, the commitment to regular refresh becomes a differentiating operational capability that competitors cannot or will not match, creating sustainable competitive advantage.
Core Versus Rotating Attractions
Strategic activity portfolios distinguish between core anchor attractions that define the park and supporting elements that add variety without requiring permanent commitment. Core attractions receive prime locations, substantial capital investment, and marketing emphasis because they represent the fundamental value proposition and primary draw. These should be high-capacity, high-repeatability elements with broad appeal across the target demographic. For a trampoline park, the main jump court serves as the core anchor; for a family entertainment center, a large multi-level soft play structure might fill this role; for an adventure park, a comprehensive ninja warrior course could be the defining element.
Core attractions should represent sixty to seventy percent of total equipment investment and occupy the most visible, accessible locations within the layout. These elements appear prominently in marketing materials, drive initial trial visits, and provide the foundation for repeat engagement. The core must be distinctive enough to differentiate from competitors while broad enough to appeal to the majority of target customers. Investing disproportionately in niche attractions that serve only small segments sacrifices the broad appeal needed for sustainable traffic volumes. The core defines what the facility is known for and what customers describe when recommending the park to others.
Supporting attractions complement the core by adding variety, serving niche interests, and extending dwell time without competing for primary attention. These might include arcade games, smaller activity stations, arts and crafts zones, interactive technology installations, or specialized equipment serving specific age groups. Supporting elements typically require lower investment, occupy less space, and can be modified or replaced more easily than core infrastructure. The ratio of core to supporting attractions depends on positioning strategy: specialized parks might dedicate eighty percent of space and budget to the core concept, while diversified family entertainment centers might spread investment more evenly across varied attraction types.
Supporting attractions serve strategic purposes beyond simple variety. They provide activities for guests waiting for popular core attractions, accommodate family members with different interests or abilities, and create opportunities for incremental revenue through premium add-ons or redemption systems. They also allow testing new concepts with limited investment before committing to major expansions. A small interactive technology installation that proves popular can inform decisions about larger technology investments in future phases. Supporting elements that fail to gain traction can be removed or replaced without fundamentally changing the facility's identity.
Rotating or seasonal attractions keep the environment fresh without permanent capital commitment. Pop-up installations tied to holidays, themed events, or current trends generate marketing opportunities and surprise existing members with new experiences. These might include temporary inflatable obstacles, seasonal activity stations, special event equipment like mobile rock walls for festivals, or limited-time interactive installations. The key is designing the layout with flexible spaces that can accommodate rotating elements without disrupting core operations or creating awkward dead zones when temporary equipment is removed.
The marketing value of rotating attractions often exceeds their direct revenue contribution. Announcing new installations generates social media engagement, email opens, and website traffic. Limited-time elements create urgency that drives visits from members who might otherwise delay. Seasonal programming provides content for year-round communication rather than repetitive messaging about static features. The operational challenge involves planning rotation schedules, managing installation and removal logistics, and ensuring each temporary addition delivers sufficient value relative to its cost and disruption.
Specialization Versus Diversification
One of the most fundamental strategic decisions involves choosing between specialized focus and diversified breadth. Specialized parks concentrate investment, expertise, and marketing on a single primary activity type—trampolines, climbing, ninja warrior, parkour—building deep reputations as the definitive destination for that specific experience. This approach attracts enthusiasts, enables premium positioning based on superior quality and variety within the niche, and creates strong brand identity that differentiates from general competitors. Specialized parks can become regional destinations, attracting visitors from wider geographic areas who seek the best facility in a particular category.
Specialization creates operational advantages through focused expertise and simplified operations. Staff training concentrates on mastering one attraction type rather than superficial competence across many. Equipment procurement benefits from vendor relationships and volume discounts. Maintenance expertise deepens through repeated experience with similar systems. Marketing messages become clearer and more compelling when focused on excellence in a defined category. The facility earns reputation as the specialist destination, attracting serious practitioners and enthusiasts willing to travel and pay premium prices for superior experiences unavailable at generalist competitors.
The risks of specialization include narrow market appeal that limits addressable audience, vulnerability to trends and changing preferences within the focused category, and difficulty attracting families with varied interests or mixed age groups. A pure trampoline park may struggle to attract toddler families or teenagers uninterested in jumping. If trampoline popularity declines or the market becomes oversaturated, the specialized facility has limited ability to pivot. Market size matters critically; smaller communities may not provide sufficient demand for specialized concepts, while major metropolitan areas can support multiple category specialists.
Diversified family entertainment centers spread investment across multiple attraction types, creating something for everyone in the family and maximizing the addressable market. This model attracts families with children of varied ages and interests, extends dwell time through activity variety, reduces dependence on any single attraction category, and supports multiple revenue streams. The trade-off involves lower depth within any particular category, more complex operations requiring diverse staff skills and maintenance capabilities, and less distinctive positioning that may compete primarily on convenience rather than excellence.
Diversification creates resilience through reduced concentration risk. When one attraction type experiences maintenance issues, seasonal variation, or declining popularity, other elements maintain traffic and revenue. Families with multiple children of different ages find value where specialized facilities might serve only some family members. The variety supports longer visits and higher per-capita spending as guests sample multiple activities and families purchase food and beverages during extended stays. Marketing can target multiple customer segments simultaneously, expanding the funnel beyond the narrow enthusiast audience that sustains specialized concepts.
The challenge of diversification is avoiding mediocrity across all categories. Spreading limited capital thinly across many attraction types can result in inadequate quality and quantity in each, creating an experience that feels like a collection of compromises rather than excellence in anything. Successful diversification requires sufficient investment to achieve threshold quality and capacity in each major category, staff capable of managing operational complexity, and marketing that communicates the value of variety rather than appearing unfocused. The facility must be large enough to accommodate meaningful representation of multiple attraction types without feeling cramped or inadequate in any category.
Market factors should guide this decision more than operator preference. Dense urban areas with significant competition may reward specialization that creates clear differentiation, while suburban or smaller markets with limited alternatives may favor diversification that serves broader needs. Available capital also influences the choice: specialization allows focusing resources to achieve excellence within a category, while diversification requires spreading the same budget across more attraction types, potentially resulting in mediocre execution everywhere. Operator expertise matters as well; a background in gymnastics or climbing might favor specialization in those areas, leveraging existing knowledge and networks.
Equipment Selection Criteria
Every equipment purchase should be evaluated against explicit criteria that balance safety, durability, appeal, capacity, and cost. Safety compliance is non-negotiable: all equipment must meet applicable standards from organizations like ASTM International and relevant regulatory bodies. Suppliers should provide documentation of testing, certification, and compliance with current standards. Materials must be non-toxic, flame-resistant where appropriate, and free of hazards like sharp edges, pinch points, or entrapment gaps. Operators should verify that suppliers maintain proper certifications and that installation will be performed by qualified professionals according to manufacturer specifications.
Durability determines total cost of ownership far more than purchase price. Commercial equipment endures intense use that quickly reveals quality differences invisible in residential or light-use contexts. Indicators of durability include material specifications like plastic thickness—high-density polyethylene should be at least three millimeters thick for commercial applications—metal gauge and corrosion resistance with powder-coated or galvanized steel for structural elements, netting strength and UV resistance using commercial-grade materials rated for extended outdoor exposure, and fastener quality specifying stainless steel hardware rather than basic zinc-plated bolts. Manufacturers confident in durability offer comprehensive warranties covering structural integrity, material defects, and normal wear for multiple years.
The difference in durability between budget and premium equipment often becomes apparent only after months or years of operation. Low-quality materials show visible wear, fading, and damage that creates poor impressions for new visitors and suggests inadequate maintenance regardless of actual care. Structural failures require unexpected capital expenses and create operational disruptions when popular attractions must close for repairs. The apparent savings from budget equipment typically disappears within two to three years through higher maintenance costs, earlier replacement needs, and lost revenue from downtime and reputation damage. Premium equipment that maintains appearance and function through years of heavy use protects both operational economics and brand perception.
Maintenance requirements directly affect operational costs and uptime. Equipment should be designed for easy cleaning with standard commercial cleaning products, routine inspection without requiring disassembly or special tools, and straightforward repair with readily available replacement parts. Modular designs that allow replacing individual components rather than entire systems reduce maintenance costs and minimize downtime when repairs are needed. Before purchasing, operators should confirm spare parts availability, typical lead times for replacement components, and whether the supplier provides ongoing technical support and training for maintenance staff. Equipment requiring proprietary parts, specialized tools, or vendor service for routine maintenance creates ongoing dependencies and cost exposure.
Capacity and throughput determine revenue potential per square meter. High-capacity attractions that accommodate many simultaneous users generate more value from premium floor space than beautiful but low-capacity elements that serve only one or two children at a time. Trampoline courts, large soft play structures, and multi-lane slides all support high throughput, while some specialty attractions like VR experiences or one-on-one climbing routes serve far fewer guests per hour. Both types have value, but the ratio should be weighted heavily toward high-capacity core attractions, with lower-capacity specialties used strategically for differentiation rather than as primary space utilization.
Marketing appeal and shareability influence customer acquisition costs and word-of-mouth effectiveness. Photogenic attractions that look impressive in images and videos generate organic social media content when guests share their experiences. Unique or unexpected elements that differentiate from standard offerings create talking points that drive word-of-mouth referrals. Attractions that deliver visible achievement—completing a difficult ninja course, reaching the top of a climbing wall, landing a new trick—provide moments guests want to share and remember. While not the primary selection criterion, marketing appeal should be considered when choosing between otherwise similar options. Equipment that generates high social sharing effectively reduces marketing costs by creating organic content and peer recommendations.
Supplier Evaluation and Relationships
Choosing equipment suppliers represents a multi-year relationship decision, not a one-time transaction. Reputable suppliers provide value far beyond manufacturing equipment: they offer design consultation, space planning expertise, professional installation, staff training, ongoing technical support, and replacement parts availability. Operators should evaluate potential suppliers on their industry track record, client references, financial stability, and comprehensiveness of services. Visiting existing installations using equipment from prospective suppliers reveals quality, durability, and customer satisfaction better than sales presentations or marketing materials.
Reference checking should be thorough and specific. Operators should contact multiple existing customers, asking about installation quality and timeliness, equipment durability over years of operation, manufacturer responsiveness to warranty claims and support requests, parts availability and replacement processes, and whether they would purchase from the same supplier again. References should include facilities similar in size and format to the planned park, preferably with several years of operating history. New suppliers with limited track records present higher risk regardless of attractive pricing or impressive prototypes.
Financial stability of suppliers matters more than many operators realize. Equipment purchases typically involve deposits months before delivery, with final payments on installation. Suppliers experiencing financial distress may fail to deliver equipment, abandon projects mid-installation, or disappear before completing warranty obligations. Even if equipment arrives, financially struggling suppliers may not support ongoing parts needs or technical assistance. Operators should research supplier business history, check for legal judgments or liens, and consider financial protections like payment bonding or escrow arrangements for large orders. The cheapest supplier often carries hidden risks that emerge only after payment is committed.
Warranty terms reveal manufacturer confidence in product quality and should be compared carefully across suppliers. Comprehensive warranties cover structural integrity for extended periods—five to ten years for major components like frames and platforms—materials and workmanship for moderate terms of two to five years for wear items like padding and netting, and clear processes for claiming coverage when issues arise. Operators should understand what is and is not covered, whether warranty service requires returning equipment or provides on-site repairs, and how labor costs are handled for warranty work. Suppliers offering minimal warranties or complex claim processes may be avoiding responsibility for quality issues.
Installation services should be professional, certified, and fully documented. Many equipment failures and safety incidents trace to improper installation rather than manufacturing defects. Suppliers should provide installation by factory-trained technicians following detailed specifications, with final inspection and certification confirming correct assembly and safety compliance. All installation work should be documented with photographs, inspection checklists, and final sign-off confirming readiness for operation. This documentation becomes critical for insurance purposes and demonstrates due diligence in safety management. Operators should resist pressure to accept equipment installation by uncertified third parties to save costs; the liability exposure and warranty implications outweigh any savings.
Summary Points
✓Equipment selection determines market positioning, revenue potential, operational costs, and competitive differentiation more powerfully than almost any other decision.
✓The activity mix should be designed strategically around target demographics, with age-appropriate equipment serving toddlers through teenagers based on developmental needs and capabilities.
✓Balancing novelty and repeatability requires prioritizing attractions that support skill progression, variable experiences, and sustained engagement over dozens of visits rather than one-time novelty.
✓Core anchor attractions should receive primary investment and premium locations, while supporting elements add variety without diluting focus.
✓The specialization versus diversification decision should be driven by market characteristics, competitive landscape, and available capital rather than personal preference.
✓Equipment evaluation criteria must emphasize safety compliance, durability, maintenance requirements, capacity, and total cost of ownership.
Safety represents the non-negotiable foundation of the entire business model. A single serious incident can destroy years of reputation building, trigger devastating lawsuits, invalidate insurance coverage, and force closure. Parents evaluate parks primarily through a safety lens, making trust and risk management fundamental to customer acquisition and retention. Superior safety performance is not merely about regulatory compliance or liability protection; it is a competitive advantage that drives marketing effectiveness, pricing power, and customer loyalty. Parks perceived as safe attract more customers, justify premium pricing, generate positive reviews, and earn referrals, while those with safety concerns struggle regardless of equipment quality or marketing investment.
Comprehensive risk management operates on multiple levels simultaneously: designing hazards out of the physical environment, establishing rigorous operational protocols, training vigilant staff, implementing legal protections, securing appropriate insurance coverage, and communicating safety measures to build parent confidence. Many operators approach safety reactively, adding protocols and padding after incidents occur. The superior approach embeds safety into every decision from initial concept through daily operations, creating systems that prevent incidents rather than merely responding after they happen. This chapter provides frameworks for building safety into design, operations, and culture.
The business case for safety excellence extends beyond avoiding catastrophic incidents. Parents make visit decisions based largely on trust, evaluating whether they believe their children will be protected. This evaluation begins with online research of reviews and reputation, continues through first impressions of facility cleanliness and staff professionalism, and solidifies through observed safety practices during visits. Parks that earn trust through visible safety measures convert trial visitors to members at higher rates, achieve higher visit frequency, and generate more referrals. The investment in superior safety systems pays returns through every business metric.
Regulatory Standards and Compliance Framework
Activity parks must comply with an ecosystem of standards developed by various organizations to address specific hazards and equipment types. ASTM International publishes numerous critical standards including F2970 for commercial trampoline court design, manufacture, installation, and operation; F1918 for soft contained play equipment safety performance specifications; and F1487 for public playground equipment. These documents provide detailed technical specifications for equipment design, installation requirements, use zone dimensions, impact attenuation, and operational protocols. Compliance with applicable ASTM standards is typically required for obtaining permits, securing insurance, and defending against liability claims.
ASTM standards are consensus documents developed through multi-stakeholder processes involving manufacturers, operators, consumer advocates, researchers, and government representatives. They represent current best practices based on injury data, research findings, and operational experience across the industry. The standards are updated periodically as new evidence emerges or new attraction types are introduced. Operators should verify they are working with current standard versions rather than outdated documents, as regulatory authorities and insurance providers evaluate compliance against the most recent editions. Membership in ASTM committees or industry associations provides advance notice of standard updates and revision processes.
The Consumer Product Safety Commission's Public Playground Safety Handbook serves as an authoritative reference providing recommendations to reduce playground-related injuries. This comprehensive resource covers hazard identification, surfacing specifications, equipment layout, accessibility requirements, maintenance protocols, and supervision guidance. While the CPSC handbook focuses on traditional playgrounds, its principles apply broadly to indoor activity parks. Hazards identified include head and neck entrapment in openings, entanglement from protrusions or drawstrings, crush and shear points in moving equipment, fall hazards requiring appropriate surfacing, and trip hazards from poor transitions or protrusions.
The CPSC handbook provides specific dimensional requirements for entrapment prevention. Openings must be either smaller than three and a half inches to prevent head entry entirely, or larger than nine inches to allow full body passage. The critical zone between these dimensions creates entrapment risk where a child's head or torso can enter but cannot exit. All equipment should be inspected for openings in this danger zone and modified through design changes or protective barriers. Similar specifications address protrusion hazards, requiring that any components extending from surfaces be either flexible, padded, or small enough not to catch clothing. Drawstrings on clothing represent specific hazards that signage should address and staff should monitor.
International operators must address additional standards depending on their market. European Standard EN 1176 covers playground equipment design, installation, and maintenance to prevent injuries from hazards like entrapment and falls. Different countries may have specific requirements for certain attraction types, such as ceiling height minimums for trampoline courts, padding thickness specifications, or staff certification requirements. Operators should work with local architects, engineers, and legal advisors familiar with applicable regulations to ensure full compliance before construction begins. Retrofitting for compliance after building is exponentially more expensive than designing correctly from the start.
Standards compliance should be viewed as a minimum baseline rather than an aspirational goal. Operators competing on safety excellence often exceed minimum requirements through thicker padding than specified, larger use zones than required, more frequent inspections than mandated, and stricter supervision protocols than recommended. This approach creates genuine safety margins while building parent confidence through visible evidence of care and professionalism. When marketing materials truthfully claim industry-leading safety practices backed by observable evidence, customer acquisition improves measurably. The incremental cost of exceeding minimum standards is typically modest compared to the competitive and risk management value created.
Designing Safety Into the Physical Environment
Protective surfacing under and around equipment with fall potential represents one of the most critical safety elements. Falls account for a substantial percentage of playground and activity park injuries, with injury severity directly related to fall height and surface impact attenuation. Use zones must be covered with materials that absorb impact energy, with specific depth or density requirements based on the critical fall height of the equipment. Options include poured-in-place rubber surfacing that provides seamless coverage and excellent accessibility, rubber tiles that offer good impact attenuation with easier replacement of damaged sections, foam padding systems designed specifically for trampoline environments, and engineered wood fiber for outdoor applications.
The depth or density of impact-attenuating materials must meet specifications outlined in ASTM F1292, which establishes performance requirements for surfacing based on fall height testing. This standard uses Head Injury Criterion testing to measure the protective capability of surfaces when subjected to impacts from various heights. Materials must demonstrate adequate impact attenuation for the critical fall height of equipment they protect. Testing reports from manufacturers should document compliance, and operators should verify that materials installed match tested specifications. Generic or non-certified surfacing materials may appear similar to compliant products but fail to provide adequate protection.
Surfacing materials lose effectiveness over time through compaction, degradation, or displacement, requiring regular testing and replenishment. Loose-fill materials like engineered wood fiber compact under use and weather, reducing protective depth. Rubber surfaces degrade from UV exposure and cleaning chemicals. High-traffic areas wear faster than peripheral zones. Operators should establish testing schedules using portable instruments that measure impact attenuation in place, identifying areas requiring maintenance before protection falls below safe levels. Documentation of testing, maintenance, and material replacement demonstrates ongoing diligence and provides critical evidence for liability defense.
Use zone calculations depend on the type of equipment and its fall height—the vertical distance between the highest designated play surface and the protective surfacing below. For stationary equipment like climbing structures, use zones typically extend six feet beyond the perimeter of the equipment, or farther for taller structures. The CPSC handbook provides detailed formulas and tables specifying required use zone dimensions based on equipment type and height. Slides require clear runout areas at the bottom where children exit at speed, with dimensions based on slide height and exit configuration. The specific requirements are detailed in standards documents and should be verified for each piece of equipment during design.
Padding systems must cover all hard surfaces within play zones where impact could occur. Structural posts, equipment frames, wall sections, edges, corners, and transition points all require thick, shock-absorbing padding designed for commercial use. The padding should extend to sufficient height above floor level, be securely attached to prevent displacement, and be inspected regularly for compression, tears, or degradation. Padding quality varies enormously; commercial-grade materials designed for activity parks outperform generic foam padding exponentially in both safety effectiveness and durability. Color selection should balance aesthetic appeal with the practical reality that padding will show wear and require periodic replacement.
Padding specifications matter significantly for both protection and durability. Commercial-grade padding designed specifically for activity parks typically features high-density foam cores that maintain shock absorption through years of impact, vinyl or similar covers rated for commercial cleaning products and resistant to tears and punctures, and attachment systems that prevent padding from shifting or falling off under normal use. The thickness of padding should be appropriate to the collision risk—higher-speed areas like trampoline court perimeters require thicker padding than low-speed zones. Some manufacturers offer padding with antimicrobial treatments that reduce odor and bacterial growth, which becomes important in facilities with intensive use.
Safety netting prevents falls from elevated structures and contains users within designated activity zones. All netting must be commercial-grade material rated for the specific application, properly tensioned to prevent dangerous slack that could allow entanglement or falls, and inspected regularly for tears, fraying, or detachment. Netting installation is a specialized skill that should be performed by certified professionals following manufacturer specifications. Improperly installed netting represents one of the most serious hazards in activity parks, potentially creating false confidence while failing to prevent falls. All netting systems should include clear documentation of installation specifications, tension measurements, and inspection schedules.
Netting specifications include material type, mesh size, tensile strength, and attachment methods. Knotted nylon or polyester netting provides high strength and durability for most applications. Mesh size must be small enough to prevent children from climbing through while large enough to prevent finger entrapment. Tensile strength ratings should account for worst-case loading scenarios including multiple users impacting simultaneously. Attachment systems must distribute loads safely across support structures rather than creating point stresses that could cause failure. UV-resistant materials are essential even for indoor installations if any natural light exposure occurs. All specifications should be documented and verified during installation inspection.
Hazard elimination through design prevents incidents more effectively than warning signs or supervision alone. Entrapment hazards occur when openings can trap a child's head, neck, torso, or limbs, leading to strangulation or severe injury. Standards specify that openings must be either smaller than three and a half inches to prevent head entry entirely or larger than nine inches to allow full body passage. Openings between these dimensions create entrapment risks and must be eliminated through design modifications. Protrusions that could catch clothing, drawstrings, or jewelry must be removed or covered. Moving parts like swing chains require guards to prevent crush injuries. Sharp edges, splinters, and rough surfaces must be eliminated through proper material selection and finishing.
The design review process should systematically evaluate every equipment component and surface for potential hazards. This review is most effective when conducted by individuals not involved in the original design, bringing fresh perspectives to hazard identification. Some operators engage third-party safety consultants to perform comprehensive assessments before opening, identifying issues that can be corrected during construction rather than discovered through incidents. The cost of third-party safety review is minimal compared to potential incident costs or the expense of retrofitting to address design flaws after opening.
Emergency egress paths must remain clear and obvious at all times, meeting local fire codes and safety regulations without exception. Exit routes should be marked clearly with illuminated signage visible from all areas of the facility, kept free of any equipment or furniture that could impede rapid evacuation, and designed to prevent bottlenecks even at maximum occupancy. The layout should include multiple egress options from all major zones, with exit doors clearly visible and easy to locate even for first-time visitors or young children. Regular inspections should verify that egress paths remain clear and that staff understand evacuation procedures specific to the layout. Emergency lighting and backup systems ensure visibility during power failures.
Operational Safety Protocols and Risk Assessment
Formal risk assessment should be conducted for each attraction, systematically identifying potential hazards, evaluating injury severity and likelihood, and implementing controls to reduce risks to acceptable levels. This process examines fall hazards, collision risks, equipment failure possibilities, entrapment scenarios, supervision failures, and behavioral dangers like unsafe use patterns. For each identified hazard, operators should document the risk level, preventive design features, operational controls like rules and supervision, and emergency response procedures. This assessment informs staff training priorities, inspection checklists, and continuous improvement efforts.
Risk assessment uses standardized frameworks that evaluate both severity of potential harm and likelihood of occurrence. Severity considers worst-case outcomes ranging from minor scrapes to life-threatening injuries. Likelihood estimates frequency based on operational experience, industry data, and expert judgment. The combination of severity and likelihood determines overall risk level and priority for mitigation. High-severity, high-likelihood risks demand immediate action through design changes or operational restrictions. Lower-level risks may be acceptable with appropriate controls and monitoring. The assessment should be documented thoroughly and revisited annually or whenever incidents suggest inadequate control.
Inspection programs must be systematic, documented, and comprehensive rather than informal or sporadic. Daily pre-opening inspections should verify that all equipment is secure, padding and surfacing are intact, netting shows no damage, use zones are clear of debris and obstacles, and lighting is functional. Weekly inspections should examine equipment more thoroughly for developing wear, test moving components, verify hardware tightness, and measure surfacing depth where applicable. Monthly or quarterly deep inspections might include bringing in third-party inspectors, testing equipment under load, verifying structural integrity, and assessing whether cumulative wear requires maintenance or replacement.
Inspection documentation creates accountability and provides critical evidence of operational diligence. Each inspection should use standardized checklists covering all required elements, with results recorded systematically rather than stored informally. Any issues discovered should be photographed, described in detail, prioritized by risk level, and tracked through resolution. Staff completing inspections should sign and date documentation, creating personal accountability. Management should review inspection results regularly to identify patterns, verify corrective actions are completed promptly, and assess whether inspection protocols are adequate. Digital inspection systems using tablets or smartphones streamline documentation while creating timestamped, organized records that are easier to analyze and retrieve than paper files.
All inspections should be documented with checklists, photographs of any issues discovered, descriptions of corrective actions taken, and sign-off by responsible staff. This documentation serves multiple purposes: it ensures inspections actually occur rather than being skipped during busy periods, creates accountability for following through on identified issues, provides trend data revealing patterns that suggest preventive maintenance or equipment replacement needs, and demonstrates due diligence for insurance and legal purposes. Regulators and attorneys evaluating facility safety management often request inspection records as primary evidence of operational standards.
Maintenance protocols should address both reactive repairs and preventive servicing. Reactive maintenance responds to identified problems—replacing worn padding, repairing damaged netting, tightening loose bolts, fixing broken equipment. Preventive maintenance follows scheduled intervals regardless of apparent condition, recognizing that some degradation is invisible until failure occurs. Manufacturer recommendations typically specify preventive maintenance schedules for different components, which should be followed rigorously. Maintenance records should document all work performed, parts replaced, costs incurred, and contractor information for warranty purposes. Tracking maintenance costs by equipment type reveals total cost of ownership and informs replacement decisions.
Staff Training and Supervision Integration
Inadequate supervision consistently appears as a contributing factor in serious activity park incidents. Staff must be trained thoroughly on safety rules for each attraction, emergency response procedures, techniques for monitoring guest behavior effectively, and intervention methods for preventing dangerous actions. Training should be hands-on and assessment-based rather than passive video viewing; staff should demonstrate proper supervision positioning, practice enforcing rules in role-play scenarios, and complete certification confirming competency before being assigned to monitor high-risk attractions independently.
Training curriculum should be structured and comprehensive rather than ad hoc. New hire orientation covers facility-wide policies, customer service standards, and general safety principles. Role-specific training then addresses the particular attractions and zones where staff will work, including detailed rules, common violations, supervision techniques, and emergency procedures. Ongoing training refreshes knowledge, introduces new procedures, and addresses issues revealed through incidents or observations. Documentation should track all training completed by each employee, certifying competency before independent assignment and recertifying periodically.
Active supervision means continuously scanning activity zones, anticipating potential hazards before they occur, and intervening promptly to prevent unsafe behavior. This differs fundamentally from passive presence where staff stand in designated positions but fail to monitor actively or enforce rules consistently. Common unsafe behaviors requiring intervention include exceeding capacity limits on trampolines, double-bouncing that causes loss of control, attempting maneuvers beyond skill level, colliding intentionally, climbing on netting or padding rather than designated structures, and entering restricted areas. Staff must feel empowered and obligated to enforce rules rather than avoiding confrontation or assuming someone else will intervene.
The culture of safety enforcement is established through management example, clear expectations, and accountability. Staff who observe managers overlooking violations or prioritizing throughput over safety will internalize that enforcement is not truly valued. Conversely, when management consistently supports staff interventions, recognizes good safety performance, and addresses enforcement failures, staff understand that safety is genuinely prioritized. Regular coaching provides feedback on supervision technique, celebrating effective interventions and correcting passive monitoring. The performance evaluation system should include safety metrics like rule enforcement observations, incident rates in supervised areas, and guest compliance with safety rules.
CPR and First Aid certification should be required for all staff, with sufficient certified personnel on duty at all times to ensure rapid response to any incident. Training should include activity park-specific scenarios like trampoline injuries, climbing falls, and head trauma rather than generic emergency response. Staff should know the location of all first aid supplies, AED devices, and emergency exits. Regular drills practice incident response, ensuring staff can execute emergency procedures under pressure rather than discovering confusion and gaps when real incidents occur. Mock scenarios might include a serious injury requiring emergency services, a fire requiring evacuation, or a missing child requiring search protocols.
Emergency drills should be conducted quarterly at minimum, with scenarios varied to test different response procedures and involve different staff teams. Drills should be treated seriously with full execution of protocols rather than superficial walkthroughs. After-action reviews identify gaps, confusion, or delays in response that require procedural changes or additional training. Some operators invite local emergency services to observe drills and provide feedback, building relationships that improve coordination during actual emergencies. Documentation of drills and reviews demonstrates operational seriousness and provides evidence of preparedness.
Incident documentation must be thorough, immediate, and factual rather than delayed or defensive. When any injury occurs, staff should complete detailed accident reports capturing what happened, who was involved, what equipment was being used, what supervision was present, what first aid was provided, and what communication occurred with parents. Photographs of the incident scene, equipment involved, and any visible injuries provide valuable documentation. Parents should be notified immediately for anything beyond minor scrapes, with honest communication about what occurred rather than defensive minimization. This transparency builds trust even when incidents happen, while defensive evasiveness destroys confidence and increases litigation likelihood.
Incident reports serve multiple purposes beyond immediate response. Analysis of incident patterns reveals systemic issues requiring operational changes—if a particular attraction generates recurring incidents, supervision may be inadequate, rules may need revision, or design modifications may be necessary. Tracking incident rates over time measures safety performance and effectiveness of interventions. Reports provide critical documentation for insurance claims and potential litigation. The documentation should be factual and complete without speculation about causes or assignment of fault, which is properly determined through investigation rather than initial reporting.
Legal Protection: Waivers and Liability Management
Liability waivers serve as one layer in a multi-faceted risk management strategy, but their enforceability varies significantly by jurisdiction and circumstance. Waivers are legal documents in which participants agree to assume inherent risks of an activity and release the facility from liability for ordinary negligence. Courts generally uphold properly drafted waivers for ordinary negligence but refuse to enforce them for gross negligence, recklessness, willful misconduct, or intentional harm. This means waivers provide some protection when incidents result from unavoidable risks inherent to activities despite reasonable safety measures, but offer no protection when operators have been egregiously careless or violated safety standards.
Waiver effectiveness depends on proper drafting, presentation, and execution. The language must be clear and conspicuous rather than buried in fine print, specifically identifying the activity and its risks rather than using generic language, and explicitly stating that liability is being waived. The waiver should be presented as a separate document requiring active signature rather than hidden among other paperwork. For minors, most jurisdictions require parent or guardian signatures with specific language acknowledging they are waiving their child's rights, though some states refuse to enforce parental waivers of minor children's rights regardless of language. Operators should consult local attorneys to ensure waivers comply with jurisdictional requirements and reflect current case law.
Jurisdictional variation in waiver enforceability creates complexity for multi-location operators. Some states have case law strongly supporting waiver enforceability when properly drafted and presented, while others show hostility to waivers particularly for minors or in recreational contexts. Operators must tailor waiver language to local legal standards rather than using generic national templates. Legal counsel familiar with local precedent should review waivers annually and after significant court decisions affecting enforceability. The waiver alone should never be considered sufficient protection; it is one component of comprehensive risk management alongside safety design, operational protocols, training, and insurance.
Waiver presentation affects both legal enforceability and customer perception. Requiring customers to review and sign waivers electronically upon booking or at check-in creates documented evidence that customers received and acknowledged risk information. However, the process should feel professional and appropriate rather than creating alarm or suggesting the facility is dangerous. Framing waivers as standard safety documentation rather than liability shields maintains positive customer perception. Staff should be trained to explain that waivers inform guests about activity risks and safety rules rather than suggesting the facility expects injuries. The tone should be matter-of-fact and reassuring rather than apologetic or alarming.
Insurance Requirements and Coverage Strategy
Comprehensive insurance coverage represents essential financial protection that allows businesses to survive incidents that would otherwise cause bankruptcy. General liability insurance forms the foundation, covering bodily injury and property damage claims when the park is found legally liable. Coverage limits typically start at one million dollars per occurrence with two million aggregate annual limits, though larger facilities or those with high-risk attractions may require substantially higher limits. Premiums vary based on park size, attraction types, revenue, claims history, and risk management practices, with annual costs often ranging from two to five percent of revenue for well-managed facilities.
Liability limits should be determined by evaluating worst-case scenarios rather than minimizing premium costs. Serious injuries can generate claims exceeding one million dollars when accounting for medical costs, lost future earnings, pain and suffering, and legal expenses. Catastrophic incidents involving permanent disability or death can reach multimillion-dollar settlements. Inadequate coverage leaves personal assets and business equity exposed when claims exceed policy limits. The incremental premium cost for higher limits is typically modest relative to the additional protection provided. Many operators carry umbrella policies providing additional millions in coverage beyond underlying liability limits at relatively low cost.
Property insurance protects the building and equipment against events like fire, natural disasters, vandalism, or theft. Coverage should reflect replacement cost rather than depreciated value to ensure adequate funds for rebuilding or replacing damaged equipment without out-of-pocket capital requirements. Business interruption coverage, often included with property insurance, compensates for lost revenue when the facility must close temporarily due to covered events. This coverage proves critical because fixed expenses like rent and loan payments continue even when revenue stops during repair or reconstruction periods. The coverage should include extra expense provisions that pay for temporary facilities or accelerated repairs to minimize closure duration.
Workers' compensation insurance is legally required in most jurisdictions, covering medical costs and lost wages for employees injured while working. Premium rates are calculated as a percentage of payroll based on job classifications, with higher-risk positions like equipment installers and maintenance staff carrying higher rates than administrative personnel. Claims history significantly affects premium costs through experience modification factors that adjust base rates up or down based on past claims. This creates strong financial incentives for preventing employee injuries through proper training, safety equipment, and work procedures. Effective workers' compensation management includes documented safety training, incident investigation protocols, return-to-work programs for injured employees, and proactive claims management.
Specialty coverage addresses risks specific to activity park operations. High-risk attractions like trampolines or go-karts often require separate policies or endorsements beyond standard general liability coverage. Some insurers exclude coverage for specific activities or impose sub-limits substantially lower than overall policy limits, making it essential to review policies carefully rather than assuming comprehensive protection. Participant accident insurance, sometimes called medical payments coverage, helps cover minor medical costs for injured guests regardless of fault. This no-fault medical coverage can prevent small incidents from escalating into larger liability claims when facilities voluntarily pay initial medical expenses without admitting liability. Coverage typically provides limits like five thousand or ten thousand dollars per incident.
Insurance procurement should involve specialized brokers familiar with activity park and family entertainment center risks rather than general commercial insurance agents. Specialist brokers understand industry-specific exposures, know which carriers offer appropriate coverage, and can negotiate better terms based on risk management practices. Operators should disclose all activities and attractions completely and accurately during application; failure to disclose high-risk attractions can void coverage entirely when claims arise. Annual policy reviews should verify that coverage remains adequate as the business grows, attractions change, or new risks emerge. Adding attractions mid-term requires policy endorsements to maintain coverage.
Building Parent Trust Through Visible Safety
Actual safety and perceived safety both matter; parents must trust that the facility is safe regardless of objective reality. Visible cleanliness communicates care and professionalism more powerfully than almost any other signal. Spotless restrooms, organized storage, absence of debris or clutter, well-maintained equipment without visible damage or wear—these observable cues tell parents that the facility maintains high standards. Conversely, dirty restrooms, scattered equipment, damaged padding, or cluttered spaces suggest poor management and raise safety concerns regardless of actual incident rates. Regular cleaning should be visible to guests, with staff actively wiping surfaces, emptying trash, and maintaining order throughout operating hours rather than only during closed periods.
The relationship between cleanliness and safety perception is psychological but powerful. Parents reason that facilities maintaining spotless environments likely extend the same care to safety systems and protocols. Conversely, facilities that tolerate visible dirt and disorganization may similarly neglect invisible safety elements. This perception operates unconsciously but influences trust significantly. Operators should view cleaning not merely as hygiene but as active marketing of safety commitment. The marginal cost of additional cleaning labor is minimal compared to the trust and confidence created.
Professional staff presentation builds confidence through appearance, demeanor, and communication. Clean uniforms with name badges identify staff clearly and communicate organizational standards. Friendly but authoritative interaction styles suggest competence and control without appearing harsh or unwelcoming. Staff should proactively explain safety rules, offer assistance, and demonstrate active monitoring rather than appearing disengaged or overwhelmed. When parents see staff consistently enforcing rules, responding promptly to issues, and maintaining order, their confidence in facility safety increases substantially.
Staff training should include customer communication about safety. Explaining rules in positive, educational language rather than punitive scolding maintains friendly atmosphere while ensuring compliance. Responding to parent questions about safety features with knowledgeable, confident answers builds trust. Acknowledging minor incidents appropriately without over-reacting or dismissing demonstrates balanced judgment. Parents evaluate staff competence continuously throughout visits, making every interaction an opportunity to build or diminish confidence.
Transparent communication about safety measures, rules, and procedures helps parents understand risk management rather than creating anxiety. Posted rules should be clear, simple, and positively framed when possible. Orientation information explaining safety features, supervision protocols, and emergency procedures provides reassurance without suggesting danger. Some parks create short orientation videos shown during check-in that highlight safety features and set expectations for guest behavior. Safety certifications, staff training credentials, equipment compliance documentation, and third-party inspection results can be displayed to demonstrate commitment to professional standards.
Social proof influences parent perception powerfully. Testimonials highlighting safety and cleanliness in reviews, family-friendly atmosphere mentioned by other parents, and visible presence of satisfied customers all build confidence. Operators should actively request reviews from satisfied customers, particularly those who mention safety and cleanliness, and respond professionally to any negative feedback addressing safety concerns. When prospective customers research the facility and consistently encounter positive commentary about safety and cleanliness, their confidence increases before they ever visit. Review responses should acknowledge concerns seriously and explain remediation actions, demonstrating accountability and commitment to continuous improvement.
Summary Points
✓Safety represents the non-negotiable foundation of successful activity park operations, influencing customer acquisition, retention, pricing power, and business survival.
✓Comprehensive risk management requires compliance with applicable ASTM standards and regulatory requirements, designing hazards out of the physical environment through appropriate surfacing, padding.
✓Legal protection requires properly drafted and executed waivers, though enforceability is limited and varies by jurisdiction.
✓Comprehensive insurance coverage including general liability, property, workers' compensation, and specialty policies provides essential financial protection.
✓Actual safety performance must be complemented by visible safety signals that build parent trust through professional presentation, cleanliness, transparent communication, and social proof.
✓Operators who embed safety into culture, design, and operations create competitive advantages that drive business success while fulfilling ethical obligations to customers.
PART V:
FINANCIAL PLANNING
Part V translates the concept and design into numbers that bankers, partners, and the operator can stand behind. It builds the revenue architecture of a diversified park, establishes pricing foundations that balance demand management with profit, and lays out the investment and unit economics that determine whether the business will generate attractive returns. These chapters turn passion into a financial model that can be tested, stressed, and defended. Done well, financial planning is what separates durable operators from those who run out of cash in year two.
Every successful activity park rests on a revenue model that does more than collect admission fees at the door. The most profitable operators in the family entertainment industry treat revenue as a layered architecture, carefully engineered so that each guest visit generates income from multiple streams rather than a single transaction. This mindset is what separates a park that survives on good weather and weekend crowds from one that produces consistent, predictable cash flow across all four seasons. Understanding how revenue fits together is the first and arguably most important exercise for anyone preparing to open the doors.
The shift toward diversified revenue reflects a broader change in consumer behavior. Families no longer simply pay for a ticket and leave; they expect an integrated experience that can include food, retail, private events, membership perks, and digital add-ons purchased well before they arrive. Operators who recognize this pattern build their pricing pages, their staff training, and even their physical layouts around capturing that broader wallet. Those who cling to a single-ticket mentality leave real money on the table, often 30 to 40 percent of the revenue their facility is capable of generating. Getting revenue architecture right is therefore not an accounting exercise but a strategic one.
This chapter maps out the major revenue categories an activity park operator should design around: admissions, memberships, parties and events, ancillary streams such as food and retail, and the growing opportunity in business-to-business sales. Each category comes with its own economics, its own operational demands, and its own benchmarks that help assess whether a park is punching above or below its weight. By the end, readers will have a framework for building a revenue mix that is resilient, profitable, and tuned to the local market rather than copied from a template.
Admission Revenue Models
Admissions remain the backbone of activity park revenue, but the structure used to sell access has a dramatic impact on both the guest experience and the bottom line. The simplest approach, hourly pricing, works well for high-turnover formats such as trampoline parks and indoor playgrounds where guests typically stay 60 to 90 minutes. An hourly model maximizes throughput during peak demand and encourages parents to plan visits around a clear budget. The tradeoff is operational complexity at the front desk and a frequent friction point when guests want to stay longer than planned.
The day-pass model, sometimes called pay-one-price, is the dominant choice for mid to large parks where the goal is to convert a visit into a half-day or full-day outing. Benchmark data from the family entertainment industry places the average day pass around 21 dollars and the average single-attraction ticket at roughly 8 dollars, numbers that set a useful reference point when positioning a new park in a local market. Day passes simplify the purchase decision, encourage longer dwell time, and create natural opportunities to sell food, retail, and add-ons once the guest is inside. The risk is that a park can fill to capacity early in the day and lose incremental visits it could have captured with an hourly model.
Punch cards and multi-visit bundles occupy a middle ground and are particularly effective for driving repeat visitation among local families. A ten-visit punch card sold at roughly 20 percent off the walk-up rate commits the customer to the park without requiring the full emotional weight of a membership decision. Seasonal passes, which typically cover a summer block or a school year, convert casual visitors into regulars and smooth revenue across the calendar. Many parks find that a tiered ladder of access options, ranging from a single attraction ticket through a season pass, allows them to meet guests wherever they are on the spectrum of commitment and price sensitivity.
Online advance-purchase pricing deserves attention within the admissions framework because it has quietly reshaped how families interact with activity parks. A meaningful share of admission revenue, often 40 to 60 percent at modern operators, now flows through online channels before the guest arrives. Pricing a small discount on advance-purchase tickets trains families to commit earlier, smooths staffing forecasts, and reduces credit card fees per transaction through lower walk-up volume. It also enables the operator to collect email addresses and build the marketing database that will drive future visits. Parks that treat the website as a secondary distribution channel rather than the primary storefront often find their yield and their data quality both suffering.
Membership Structures
Memberships have quietly become one of the most valuable innovations in the family entertainment space, borrowing directly from fitness clubs and streaming services. A well-designed membership program transforms volatile, weather-dependent attendance revenue into predictable monthly cash flow that can be used to cover rent, payroll, and loan service. For parks in competitive markets, a loyal membership base also becomes a defensive moat, making it harder for a newcomer to pry local families away with discounts or grand-opening campaigns.
The most common structure is an unlimited monthly pass priced to break even after roughly two to three visits per month. A family of four might pay somewhere between 70 and 120 dollars per month for unlimited access, a price that feels justified given that a single day-pass visit for the same family can easily exceed 80 dollars. Family plans that bundle two, three, or four members at a slight per-person discount encourage households to lock in together, raising switching costs and increasing the per-account revenue. Parks that layer in a modest annual commitment, rather than pure month-to-month, see significantly lower churn and higher lifetime value.
Off-peak tiers open the door to a different customer segment: retirees, stay-at-home parents of toddlers, homeschool families, and anyone with flexible schedules. By pricing weekday daytime access at 40 to 50 percent below the unlimited tier, operators fill otherwise empty hours without cannibalizing peak-period revenue. The pricing psychology here draws on anchoring and reference pricing; when a guest sees an unlimited tier at 99 dollars next to an off-peak tier at 49 dollars, the off-peak offer feels like a clear bargain even though its margin to the operator is often higher because it runs against fixed costs that would otherwise go uncovered. Thoughtful tiering is where membership programs move from a nice feature to a true profit engine.
Party and Event Revenue
Birthday parties are the single highest-margin product most activity parks sell, and they deserve dedicated attention from the earliest days of planning. A typical party package that bundles admission for 10 to 15 children, a private room for 90 minutes, pizza, drinks, and a dedicated host can generate 400 to 700 dollars in revenue at gross margins north of 60 percent. The math works because most of the cost is already fixed; the incremental food and labor for a party rides on top of overhead the park was paying anyway. Parks that merchandise parties well, with clear tiers, easy online booking, and a memorable in-park experience, can generate 20 to 30 percent of total revenue from birthdays alone.
Group bookings extend this logic into weekdays and shoulder seasons. School field trips, summer camps, scout groups, and youth sports teams fill otherwise quiet hours and provide reliable, pre-paid revenue booked weeks or months in advance. Industry benchmark data from the family entertainment center sector suggests that group sales can account for as much as 37 percent of admissions at well-run facilities. Capturing that share requires a dedicated group sales effort, simple contracts, flexible pricing that reflects the guaranteed volume, and a reputation among teachers and coaches for running trips smoothly.
Corporate and private events are the highest-value tier of the event business and tend to be underdeveloped at most activity parks. A weekday evening buyout for a corporate team-building night can generate 5,000 to 25,000 dollars in a window when the park would otherwise be nearly empty. Organizations looking for offsite meetings, holiday parties, and client appreciation events value the novelty of an activity park setting, and they are far less price sensitive than a birthday parent. Building this channel requires a dedicated sales contact, simple corporate-friendly packages, and the willingness to close the park for private use when the numbers justify it. Parks that crack the corporate code often find it changes the profit profile of the entire business.
Event-selling operations also benefit from dedicated staff and proper tools. Parks that assign a single full-time or part-time event coordinator responsible for responding to inquiries within 60 minutes, sending professional contracts, and running pre-event checklists consistently outsell parks where front-desk staff handle party calls between admissions transactions. A simple customer relationship management system, even a basic one, pays for itself within months through improved booking conversion and fewer dropped opportunities. The event channel is not an accident waiting to happen; it is a sales function that rewards the same professionalism as any other B2B sales organization.
Ancillary Revenue Streams
Ancillary revenue, meaning any dollar that does not come from an admission or membership fee, is where well-run parks pull ahead of the pack. Industry benchmarks suggest ancillary revenue should represent 35 to 40 percent of total revenue at a healthy facility, and some family entertainment centers push that ratio even higher. The categories are familiar: food and beverage, retail, photos, required items like grip socks, locker rentals, arcade games, and a growing roster of premium add-ons. What separates a 20 percent ancillary park from a 40 percent ancillary park is not the menu but the discipline of merchandising, the quality of the offerings, and the ease of purchase.
Food and beverage is the largest ancillary category and can contribute 25 to 40 percent of total revenue at facilities that invest in a real food program. Margins on pizza, snacks, and beverages routinely exceed 60 percent, and the category benefits from captive demand. Families who arrive hungry or stay past a mealtime will spend, and the only question is whether they spend at the park or leave to eat elsewhere. Successful operators design their food experience to remove friction: clean menus, mobile ordering, visible prices, and enough seating to accommodate a crowd. Parks that treat food as an afterthought give up tens of thousands of dollars in monthly revenue that is already sitting inside their four walls.
Retail, photos, and service add-ons round out the category. Branded t-shirts, grip socks (often a required purchase at trampoline parks), water bottles, and small souvenirs convert a visit into a memory and a marketing asset every time the shirt gets worn. On-ride and greenscreen photo packages appeal to the Instagram-minded parent and carry software-like margins. Service offerings such as express pass upgrades, cabana rentals, locker rentals, and premium parking monetize the willingness of some guests to pay for comfort and convenience. Arcade games remain a significant revenue generator in many family entertainment centers and work particularly well as a waiting-area attraction when the main floor is at capacity. Each of these streams is individually modest but together they are often the difference between a good year and a great one.
Mobile ordering and self-service kiosks have emerged as a powerful margin lever in the ancillary category. Guests using a phone or kiosk to order food typically spend 15 to 25 percent more per ticket than guests ordering at a counter, because the digital interface encourages browsing and removes the social friction of asking for an upgrade. Labor savings compound the benefit, freeing staff to focus on speed of fulfillment and table cleanliness. The technology has dropped to a price point where even modest operators can justify the investment within the first year of operation. Treating ancillary revenue as a merchandising challenge rather than an operational one is the mindset that consistently produces outsized results.
B2B Opportunities
Business-to-business revenue deserves its own discussion because it requires a different operational muscle than serving walk-in families. Beyond the corporate events already mentioned, activity parks can partner with school districts on physical education programming, with parks and recreation departments on summer camp overflow, and with nonprofits on fundraising nights where the park shares a portion of proceeds in exchange for community exposure. These B2B arrangements tend to be lower margin per transaction but far higher in volume and predictability, and they build local goodwill that pays dividends in word-of-mouth marketing.
A growing subset of B2B opportunity is the contracted fitness or activity class. Homeschool co-ops, ninja warrior leagues, youth cheer programs, and adult fitness groups are all willing to pay for scheduled, instructor-led time on park equipment. Because these groups book in multi-week blocks, they generate reliable revenue during midday weekday hours that are traditionally dead time. The operational lift is modest, usually requiring a trained instructor and clear scheduling, and the contribution margin is excellent. Parks that publish a simple rate card for private group use and assign one staff member to manage outreach can often add six-figure annual revenue from this channel within a year or two of opening.
Finally, sponsorships and brand partnerships represent an underexplored B2B stream. Local businesses, regional brands, and even national consumer brands targeting families will pay for naming rights on attractions, signage in high-traffic areas, or presence at park events. These deals require a modest media kit and a willingness to sell, but they are almost pure margin because the physical assets already exist. A park generating one to three percent of revenue from sponsorships is doing meaningful work; a park generating zero is likely leaving easy dollars on the table.
Revenue Diversification and Benchmarks
The final lens on revenue architecture is diversification itself. A park that derives 80 percent of its revenue from walk-in admissions is exposed to every bad weather weekend, every school schedule shift, and every new competitor. A park with a balanced mix of admissions, memberships, parties, food, retail, and B2B revenue absorbs those shocks far more gracefully. Investors and lenders routinely favor the diversified model because it produces smoother cash flow and a higher-quality earnings profile, often justifying a higher valuation multiple on exit.
Useful benchmarks help operators judge where they stand. A healthy mid-size family entertainment center typically sees admissions in the 50 to 60 percent range, food and beverage at 20 to 30 percent, parties and events at 10 to 20 percent, and retail and ancillary in the 5 to 10 percent range. Trampoline parks that have matured their food programs and party calendars report annual unit revenues between 2.1 and 2.5 million dollars per location, with Sky Zone reporting a 2024 average unit volume of roughly 2.2 million dollars per park. These are achievable numbers, not aspirational ones, and they should anchor the financial model of any serious developer.
The practical takeaway is that revenue architecture is a design choice made before the park opens, not a discovery made afterward. Decisions about ticket structure, membership tiers, party rooms, food service, and sales channels dictate what is possible from day one. Operators who invest the time to map their revenue architecture against industry benchmarks, stress-test it against realistic attendance assumptions, and build the operating infrastructure to execute it will find themselves in a very different financial position than competitors who treat revenue as whatever happens to walk through the door.
Benchmarking revenue diversification is most useful when it is paired with a realistic view of the local market. A park in a tourist-heavy destination may see a higher share of single-visit admission revenue simply because repeat frequency is structurally limited by visitor origin. A park in a dense suburban market with a young-family demographic will tilt far more heavily toward memberships and parties. The revenue mix is therefore not a single ideal target but a range that should be calibrated to the trade area. Operators who try to force a tourist-market mix into a suburban box, or vice versa, usually underperform the potential of the site they actually occupy.
A final, often overlooked layer of revenue architecture is the calendar itself. Weekends, school breaks, and summer weeks produce the majority of walk-in admissions. Weekday mornings and early afternoons are the natural home of toddler programs, homeschool groups, corporate events, and senior or adult fitness classes. Weekday evenings serve leagues, private rentals, and date-night promotions. Parks that map their revenue architecture against a 168-hour weekly grid quickly discover dead zones they can monetize with purpose-built programming. The exercise often uncovers six-figure annual opportunities hiding in plain sight, and it is one of the most productive planning sessions any management team can run in its first year of operation.
Summary Points
✓Admissions form the revenue backbone, but hourly, day-pass, punch-card, and seasonal formats each serve different customer segments and should be layered deliberately.
✓Industry benchmarks place the average single-attraction ticket near 8 dollars and the average day pass near 21 dollars, providing useful anchors for new-market pricing.
✓Memberships convert volatile attendance into predictable monthly revenue and, when tiered with family and off-peak options, meaningfully raise customer lifetime value.
✓Birthday parties generate gross margins above 60 percent and can contribute 20 to 30 percent of total revenue at parks that merchandise them professionally.
✓Group sales, including schools, camps, and youth sports.
✓Corporate and private-event buyouts are the highest-value event tier, capable of generating 5,000 to 25,000 dollars per booking in otherwise quiet windows.
If revenue architecture determines which dollars are possible, pricing determines which dollars actually land. Pricing is among the most consequential decisions an activity park operator makes, and it is also among the most commonly mishandled. Many new parks set their opening prices by glancing at the nearest competitor, adding a few dollars, and calling it a strategy. That approach ignores the underlying economics of the business, the psychology of the family buyer, and the real levers that drive profitability over a multi-year operating horizon. A well-considered pricing approach is not an accounting output; it is a marketing tool, a demand-management tool, and a profit engine all at once.
The right pricing strategy balances four sometimes competing objectives: capturing enough revenue to cover a high fixed-cost base, positioning the park appropriately against alternatives, managing capacity across peak and off-peak windows, and preserving the perception of fairness that keeps families coming back. Getting that balance right requires thinking beyond a single published rate. It requires a framework that combines competitive awareness, value communication, dynamic flexibility, and discipline about when and how to discount. This chapter presents that framework in practical, operator-ready terms.
Readers will move through competitive analysis, the choice between value-based and cost-plus methods, the use of peak and off-peak pricing, the economics of membership pricing, and the risks and rewards of discounting and promotions. The chapter closes with a discussion of price elasticity in family entertainment, a concept that sounds academic but has very concrete implications for how aggressively a park can raise prices without losing the customer. The goal is a pricing posture that is defensible to investors, intuitive to front-line staff, and invisible enough to guests that they never feel squeezed.
Competitive Pricing Analysis
Every pricing conversation should begin with an honest, structured look at the competitive set. That set is broader than it first appears. Direct competitors, such as other trampoline parks or indoor playgrounds within a 15-minute drive, matter most, but indirect competitors shape perceived value just as powerfully. A family choosing between a Saturday at an activity park, a movie theater outing, a bowling afternoon, a children's museum visit, or a restaurant-and-arcade combination is running a mental price-per-hour calculation whether they realize it or not. A park that prices blindly against other trampoline operators while ignoring the movie theater next door can end up looking overpriced for the experience it delivers.
A useful exercise is to build a simple competitive pricing grid that lists every meaningful alternative within the trade area and captures their published rates, typical visit length, and any hidden costs such as food minimums or required purchases. The grid should then translate each experience into a rough cost-per-hour-per-person, because that is the apples-to-apples comparison a parent runs intuitively. Against that backdrop, a park can decide whether to position at the premium end, the value end, or somewhere in between. The decision should align with the physical facility, the brand promise, and the target demographic, not with the emotions of the founder on opening week.
Competitive analysis also informs the structure of published pricing, not just the levels. If every nearby competitor sells a flat day pass, a park that introduces hourly pricing will need to explain the value clearly or risk appearing more expensive than it is. Conversely, a market crowded with hourly operators offers an opening for a pay-one-price format that promises families a predictable full-day outing. The competitive set sets the expectations; the operator decides whether to match, exceed, or deliberately break from them.
Value-Based vs. Cost-Plus Approaches
Two broad pricing philosophies compete for the operator's attention. Cost-plus pricing starts with what the park costs to run, adds a target margin, and produces a price. It is easy to explain, easy to defend to an accountant, and dangerously disconnected from what customers are actually willing to pay. A park that spent heavily on premium equipment will, under cost-plus logic, set higher prices than a park that cut corners, even if the two experiences feel similar to a guest. Worse, a park facing rising rent or labor costs may be pushed by cost-plus reasoning into prices the market simply will not bear.
Value-based pricing starts from the opposite end. It asks how much the guest values the experience and sets prices against that ceiling, using cost only as a floor that must be cleared. In practice, this means conducting lightweight market research before and after opening: exit surveys, willingness-to-pay questions embedded in post-visit emails, and A/B testing of package configurations on the website. Parks that learn to price against perceived value routinely achieve margins several points higher than cost-plus competitors, because they identify the features and packages that guests actually reward with their wallets.
The practical answer is almost always a hybrid. Cost-plus provides the floor and the margin discipline; value-based insight determines where inside the acceptable range each product should sit. A family birthday package with a dedicated host, a private room, and a memorable send-off commands a value premium that has little to do with its underlying food cost. A midweek off-peak hourly rate, on the other hand, lives closer to the cost floor because its job is to fill empty capacity. Operators who can hold both lenses simultaneously, rather than choosing one as a religion, end up with pricing that is both profitable and durable.
A practical rule of thumb is to price packages at visible, rounded numbers and to avoid the penny-ending gimmicks that work in grocery aisles but feel out of place in family entertainment. A day pass at 24.99 dollars communicates thrift-store pricing; a day pass at 25 dollars communicates confidence. Inside party packages, the same logic applies at larger thresholds. A basic party at 299 dollars, a premium party at 499 dollars, and a deluxe option at 799 dollars create a clean ladder in the guest's mind. The spread between tiers should be large enough to justify trading up, typically 40 to 70 percent, which mirrors the psychology behind wine list pricing and other discretionary categories. Clean architecture is itself a form of pricing power.
Peak, Off-Peak, and Dynamic Pricing
Activity parks are capacity-constrained businesses with wildly uneven demand across hours, days, and seasons. A Saturday afternoon may run at 120 percent of comfortable capacity while a Tuesday morning runs at 10 percent. Flat pricing across that spread leaves money on the table twice: it underprices peak moments when guests would gladly pay more and overprices slow moments when a lower rate would pull in marginal customers. Peak and off-peak pricing corrects both errors and has become standard practice across family entertainment, fitness, travel, and hospitality.
The simplest implementation is a two-tier calendar: higher weekend and holiday pricing, lower weekday and early-morning pricing. More advanced operators move to a three- or four-tier grid that distinguishes between prime Saturday afternoons, shoulder Saturday mornings, weekday evenings, and slow weekday daytime slots. The prices attached to each tier should differ enough to shift behavior; a five percent difference is noise, while a 25 percent difference actually motivates a family to shift their visit. The clearer and more visible the calendar, the more demand-shaping it does.
Dynamic pricing extends this logic into near-real-time adjustments driven by advance-purchase data, weather forecasts, and event calendars. Parks that sell tickets online can raise prices as a given time slot fills, a technique borrowed directly from the airline playbook. The technology required is increasingly affordable, and the revenue upside on peak dates is substantial. The guardrail is guest perception; surprise price spikes at the door breed resentment, while gentle online surcharges for the most popular slots feel like normal market behavior. Operators who introduce dynamic pricing should do so with clear communication and a commitment that walk-up rates never exceed advertised ceiling prices.
Membership Pricing and Breakeven
Membership pricing deserves its own treatment because the math differs fundamentally from single-visit pricing. A monthly membership is effectively a bet between the park and the member about how often the member will visit. Price the membership too low relative to single-visit rates and heavy users will cannibalize walk-in revenue without delivering the loyalty benefits. Price it too high and the program fails to attract enough enrollees to justify the operational overhead of running it.
The common benchmark is to set the monthly unlimited price at roughly two to three walk-in visits. If a family day pass runs 80 dollars, a family membership at 160 to 200 dollars per month encourages the family to commit while still producing a healthy margin on members who visit four or more times. The critical insight is that most members, like most gym members, visit less than they expect to at signup. A well-run membership program typically sees average monthly visits between 1.8 and 2.6, which leaves meaningful margin on top of the walk-in-equivalent pricing.
Operators should run explicit breakeven analysis on their membership tiers before launch and review it quarterly. The analysis should include the variable cost of each member visit, the allocated share of fixed costs, the cost of any included perks such as party discounts or guest passes, and a realistic churn assumption. A membership that appears profitable at an average of two visits per month may turn unprofitable if heavy users average five visits and dominate the mix. Tiered memberships, usage caps on promotional tiers, and off-peak restrictions on the lowest-priced plan are the standard tools for keeping membership economics healthy as the base scales.
A frequently missed refinement is geographic pricing. Operators serving multiple trade areas with different income profiles and competitive sets can and should vary prices by location. A park in a dense, affluent suburb can often sustain day-pass pricing 15 to 25 percent above an otherwise identical park in a lower-income market without meaningful volume loss. Publishing the pricing online makes this transparent, and few customers actually cross-shop between metros. The discipline is to underwrite each location on its own demand curve rather than applying a national rate card that simultaneously overprices weaker markets and underprices stronger ones.
Discounting Strategies and Risks
Discounting is the most commonly misused tool in the pricing toolkit. Used deliberately, it can fill slow hours, acquire new customers, and reward loyalty. Used reflexively, it trains the market to wait for the next coupon and compresses margin in ways that can take years to reverse. Every discount decision should answer two questions: what behavior is this discount designed to create, and what is the expected margin after the discount is applied and any incremental variable costs are deducted.
The healthiest discount structures are narrow, time-bound, and tied to behaviors the park wants to encourage. A midweek-morning rate aimed at stay-at-home parents, a military or first-responder rate aimed at community goodwill, a homeschool afternoon rate that fills dead hours, and a loyalty bounce-back offer that brings a first-time guest back within 30 days all meet that standard. Broad, untargeted discounts, such as a sitewide 30-percent-off weekend, rarely pay back their margin cost and can poison the perception of full-price value for months afterward.
Third-party discount channels, including Groupon and similar platforms, warrant special caution. They can drive volume during an opening window when awareness is the limiting factor, but sustained reliance on them erodes pricing power, attracts deal-seeking customers with low lifetime value, and signals to the core market that full price is optional. Parks that use these channels should treat them as a limited-time launch tool, cap the number of vouchers sold, and invest the incremental traffic into capturing email addresses and memberships that turn one-time deal hunters into repeat full-price customers.
Loyalty currencies, points programs, and bounce-back coupons sit at the intersection of discounting and customer retention and deserve dedicated thought. A simple program that earns a free guest pass after every fifth paid visit costs the park little in marginal terms because the free visit largely rides on existing fixed costs, yet the perceived value drives meaningful repeat behavior. Embedding loyalty into the membership experience, rather than running it as a separate punch card, simplifies the message and concentrates the data in one place. The art is to make the reward feel generous to the guest while keeping the actual cost to the operator firmly under control.
Promotional Pricing and Price Elasticity
Thoughtful promotional pricing serves two purposes beyond raw revenue generation: it creates news and it tests elasticity. A well-timed summer kickoff promotion, a back-to-school membership drive, or a holiday gift card push gives the marketing team something fresh to talk about and gives local media a reason to cover the park. Promotions should be calendared in advance, budgeted for incremental volume rather than cannibalized volume, and measured on contribution margin rather than top-line revenue.
Price elasticity, the measure of how demand responds to price changes, is particularly relevant in family entertainment because the category sits squarely in discretionary spending. Families can, and do, substitute other activities when prices climb. Research on entertainment pricing consistently shows that demand is moderately to highly elastic: a 10 percent price increase can produce a 10 to 20 percent volume drop in competitive markets, though the effect is smaller in markets with few substitutes or strong brand preference. Operators should therefore treat every price increase as an experiment, track volume and revenue outcomes for at least one full month, and be ready to adjust.
The practical elasticity playbook is to raise prices in small, frequent steps rather than rare large jumps. Annual increases of three to five percent, paired with visible improvements to the guest experience, tend to flow through almost entirely to revenue with minimal volume impact. A single 15 percent jump, by contrast, can trigger loud complaints and measurable attrition even when the absolute price remains competitive. Pricing, in this sense, is less a one-time decision than an ongoing conversation with the market, conducted through small moves, careful measurement, and the humility to reverse course when the data disagrees with the plan.
An underappreciated dimension of pricing is the experience of buying itself. Families weigh not only the number on the ticket but the clarity, speed, and friction of the purchase. A website that clearly shows prices, available time slots, and what is included in each package converts far better than one that hides details behind a clunky booking flow. Parks that introduce mandatory fees late in the checkout process, such as waiver fees, booking fees, and required sock purchases discovered only at the register, train customers to distrust them. A transparent, all-in price, even if nominally higher, often produces better conversion, higher satisfaction, and stronger repeat visitation than a headline-low price surrounded by add-ons.
Gift cards, prepaid packages, and advance-purchase incentives represent a quiet but meaningful pricing lever. Selling a 100-dollar gift card in November produces cash in November, a portion of breakage revenue from cards that never fully redeem, and a future visit that statistically skews toward higher-than-average spending because the guest arrives feeling they are playing with house money. Parks that build gift-card campaigns around holidays, teacher appreciation weeks, and corporate-gifting seasons capture working capital and future visits in a single motion. The mechanics are simple, the margins are excellent, and the channel scales without materially increasing operating complexity.
Summary Points
Pricing strategy is a marketing, demand-management, and profit tool rolled into one, not a simple output of cost accounting.
Competitive analysis should include direct and indirect alternatives, translated into a cost-per-hour-per-person view that mirrors how families actually decide.
Cost-plus pricing provides a floor and margin discipline. value-based pricing identifies the ceiling, and the best operators blend both lenses.
Peak and off-peak pricing should differ by at least 20 to 25 percent to meaningfully shift guest behavior across the calendar.
Dynamic pricing can materially lift peak-period revenue when communicated clearly and capped against walk-up rates.
Monthly membership pricing typically sits at two to three walk-in visits, with real-world average usage of 1.8 to 2.6 visits per month preserving margin.
Building an activity park is a capital-intensive undertaking, and the numbers involved have a tendency to surprise even experienced entrepreneurs. A modest family entertainment center can be launched for a few hundred thousand dollars, while a full-scale trampoline park, adventure park, or multi-attraction complex can require several million dollars of upfront investment before a single guest walks through the door. Understanding where that capital goes, which line items are negotiable, and what return it should generate over time is the foundation of any credible business plan. This chapter translates the capital story into the unit economics that lenders, investors, and operators ultimately care about.
Unit economics, in this context, describe how a single park performs on a standalone basis, setting aside corporate overhead, financing structure, and growth investment. The key questions are deceptively simple: How much does it cost to build the park? How much revenue does it generate per visit, per square foot, and per customer? What does it cost to operate, broken into fixed and variable components? What contribution margin survives after variable costs? How long does it take to recover the initial investment? Parks that can answer these questions with clarity and defensible numbers are positioned to raise capital, negotiate leases, and make operating decisions that compound into durable profitability.
The chapter walks through the full capital stack, from real estate and construction through equipment and soft costs, before turning to the operating metrics that define success. Benchmarks drawn from the trampoline park, family entertainment center, and broader amusement industry anchor each section. The goal is to equip owners, investors, and developers with a numerical vocabulary they can use when they build their own pro formas and sit across the table from lenders, landlords, and equipment vendors.
Total Investment Breakdown
The total capital required to open an activity park varies enormously with format and scale. A small family entertainment center focused on a handful of attractions can open for roughly 200,000 to 500,000 dollars. A full-service trampoline park with 20,000 to 30,000 square feet of activity space, a food program, and party rooms typically requires 1.5 to 4 million dollars. Large outdoor adventure complexes with significant earthworks, ropes courses, and multiple themed zones can run well into the tens of millions, and flagship destination parks climb into the billions. Anchoring expectations to the right format is the first step in producing a realistic capital plan.
Within the total, several categories consistently dominate the budget. Real estate, whether purchased or leased, is typically the largest long-term financial commitment, with warehouse space suitable for trampoline and climbing formats renting for roughly 18 to 22 dollars per square foot per year in most North American secondary markets. Construction and tenant improvements, including flooring, HVAC upgrades, electrical capacity, bathrooms, and party rooms, often represent the single largest upfront cash outlay, particularly in warehouse conversions where the landlord delivers a shell. Equipment, meaning the trampolines, climbing walls, arcade machines, soft-play structures, and associated safety pads, commonly accounts for 30 to 50 percent of total startup cost in action-oriented parks.
Furniture, fixtures, and equipment beyond the attractions themselves round out the picture. This category covers point-of-sale systems, kitchen equipment, lockers, signage, office setup, and the dozens of smaller purchases that accumulate quickly in the months before opening. Soft costs, which include architectural and engineering design, permits, legal fees, insurance deposits, franchise fees if applicable, and pre-opening marketing, typically run 10 to 20 percent of hard construction and equipment costs. A disciplined developer tracks each category against benchmarks throughout the project, because overruns compound and a budget that slips 15 percent in three categories can erase an entire year of projected profit.
Negotiating leverage is most powerful at two specific moments in the project: lease negotiation and equipment purchase. On the real estate side, landlords with vacant warehouse space in secondary markets are often willing to grant 4 to 8 months of free rent during construction, contribute tens of thousands of dollars in tenant improvement allowance, and accept 5 to 7 year terms with renewal options that give the operator flexibility. On the equipment side, vendors will typically discount list pricing by 10 to 20 percent on full-park orders and provide favorable financing terms for established operators. Walking into both negotiations with multiple competing bids in hand is the single highest-return activity in the entire project budget.
Cost per Square Foot Benchmarks
Cost per square foot is the single most useful benchmark for comparing parks of different sizes and formats. On the expense side, trampoline equipment costs run approximately 5.50 to 8.40 dollars per square foot of jumping surface, a figure that climbs with specialty attractions such as ninja courses, dodgeball courts, and foam pits. Overall buildout costs, including tenant improvements, flooring, lighting, and basic attractions, typically land between 60 and 150 dollars per square foot in warehouse conversions, with urban or highly themed projects pushing well above that range.
On the revenue side, the same metric provides a useful sanity check. A healthy family entertainment center generates 120 to 200 dollars in annual revenue per square foot of gross leasable space, with top performers exceeding 200 dollars per square foot and struggling operators falling below 100. A park projecting revenue that implies 300 dollars per square foot in year one should be viewed with skepticism unless the concept clearly justifies a premium, and a park projecting less than 100 dollars per square foot should expect to fight for a loan. These ranges are not hard rules, but they are gravity.
The ratio of revenue per square foot to cost per square foot is also informative. A well-underwritten project targets at least 1.5 dollars of first-year revenue per dollar of buildout cost, with mature-year revenue climbing higher. Projects that fall short of this ratio either need a cost reduction, a scope increase, or a honest conversation about whether the site and concept support the investment. Walking away from a marginal project is almost always cheaper than building it and discovering the math does not work once the doors are open.
Project timing is itself a financial variable that often gets short-changed. A typical trampoline park or family entertainment center build runs 6 to 12 months from lease execution to opening day, with permitting in difficult jurisdictions occasionally pushing the timeline beyond a year. Each additional month of pre-revenue carrying costs, including rent, insurance, and security, can add 30,000 to 80,000 dollars to the project budget. Operators who negotiate generous rent abatement during the build period, sequence permit applications in parallel rather than in series, and pre-order long-lead-time equipment as early as feasible routinely save six figures relative to peers who treat the schedule as an afterthought.
Working Capital and Contingency
Two line items are consistently underestimated in first-time operator budgets: working capital and contingency. Working capital is the cash needed to cover payroll, rent, utilities, marketing, and food inventory during the months between opening and the point at which operations cover their own costs. Industry guidance suggests a working capital reserve of 5 to 10 percent of total startup cost, which for a standard trampoline park build often translates to 300,000 to 500,000 dollars sitting in a dedicated operating account on opening day.
Contingency is the cousin of working capital and covers the construction and pre-opening surprises that always surface. Industry practice is to carry a contingency of roughly 10 percent on hard construction costs, with more prudent developers pushing it to 15 percent for complex builds or older buildings with unknown conditions. The contingency is not a slush fund for scope creep; it is a reserve against the surprises that are guaranteed to occur, such as permitting delays, structural modifications, HVAC upgrades, utility tie-in fees, and equipment lead-time extensions.
Operators who run out of working capital or contingency before hitting stabilized performance face the worst kind of financial pressure: being forced to cut marketing, staffing, or maintenance at precisely the moment when those investments would save the business. The discipline is to raise enough capital at the outset to fund not just the build but the first 6 to 12 months of operations under a conservative attendance scenario. Lenders and equity investors generally respect operators who come to the table with this buffer already sized into the ask, because it signals seriousness and reduces the risk of a painful follow-on raise.
Key Performance Metrics
Once the doors are open, a handful of performance metrics do most of the heavy lifting in management reporting. Average revenue per capita, often abbreviated ARPC, measures the total revenue generated by each visitor across admissions, food, retail, and ancillary purchases. For trampoline parks and family entertainment centers, ARPC typically lands between 18 and 30 dollars, with food-forward and party-heavy operations pushing toward the upper end of the range. Improvements in ARPC generally flow almost entirely to the bottom line because the underlying visit already carries the full fixed cost.
Revenue per square foot, discussed in the earlier section, measures how efficiently the facility converts space into sales. Revenue per customer extends the ARPC concept by looking at the lifetime relationship rather than a single visit; a member who visits 20 times per year at 10 dollars of incremental food spend each time produces a very different profile than a once-a-year birthday guest. Attendance per operating hour, ticket conversion from website visits, average party revenue, and food attachment rate round out the weekly scorecard most professional operators review.
The discipline that matters most is turning these metrics into decisions. A declining ARPC over three consecutive months should trigger a review of the food menu, retail offerings, and upsell flow. A stubbornly low food attachment rate might point to signage, staff training, or menu pricing rather than demand. A revenue per square foot that lags the benchmark suggests either a merchandising problem or a capacity-utilization problem that scheduling adjustments can solve. Metrics without action are a vanity exercise; metrics that drive weekly operating decisions are the quiet engine of profitability.
Cohort analysis is the discipline that turns these metrics from a scorecard into a forecast. By tracking each month's new guests as a cohort and watching their repeat behavior over the following 12 months, operators can calibrate the true lifetime value of a first-time visitor and set realistic customer acquisition spending limits. A cohort that averages 2.1 return visits in its first year at 25 dollars of contribution margin per visit is worth roughly 53 dollars to the park beyond the initial admission, which sets the ceiling on what paid advertising can justify per new customer. Without cohort analysis, marketing budgets tend to get set by feel rather than by math, and the park either overspends on acquisition or starves itself of growth.
Cost Structure: Fixed vs. Variable
Activity parks are classic high-fixed-cost businesses. Rent, insurance, property taxes, management salaries, core equipment maintenance, software subscriptions, and loan service accumulate whether the park hosts 50 guests or 500 on a given day. Variable costs, including hourly labor, food and beverage cost of goods sold, party supplies, consumables, utilities above baseline, and credit card processing fees, move with volume. Understanding the split between these two buckets is essential to pricing, staffing, and decisions about when to expand hours.
Benchmark operating ratios for family entertainment centers provide useful guardrails. Payroll commonly runs 25 to 35 percent of revenue, with the most efficient operators holding the line near the lower bound through careful scheduling and cross-training. Rent tends to consume 8 to 18 percent of revenue depending on location quality and whether the park is urban or suburban. Food and beverage cost of goods sold sits in the 25 to 35 percent range, with disciplined menu engineering and supplier negotiation keeping the better operators near the lower end. These benchmarks are a starting point for budgeting and a diagnostic tool when actual results drift.
The strategic implication of a high-fixed-cost model is that incremental revenue is extraordinarily valuable. Every additional guest on a Tuesday afternoon, every upsell from a small drink to a large, every party booked into a previously empty room produces contribution margin at something close to 60 to 80 percent. Operators who internalize this truth invest aggressively in the activities that fill marginal capacity: midweek marketing, off-peak membership tiers, corporate event outreach, and B2B partnerships. Operators who fixate only on reducing fixed costs often discover they cannot cut their way to prosperity in a business whose economics reward filling seats.
Contribution Margin and Breakeven
Contribution margin, the revenue remaining after variable costs are deducted, is the number that most directly drives park profitability. At a well-run activity park, contribution margin typically runs 55 to 70 percent of revenue, meaning every dollar of additional sales throws off 55 to 70 cents to cover fixed costs and produce profit. That structure is why volume is so consequential in this industry and why operators obsess over attendance, conversion, and per-capita spending.
Breakeven analysis takes contribution margin and divides it into total fixed costs to produce the revenue level at which the park covers its obligations. For a trampoline park carrying 2 million dollars in annual fixed costs at a 60 percent contribution margin, breakeven revenue sits around 3.3 million dollars. Every dollar of revenue beyond that point contributes disproportionately to profit, which is why the difference between a 2.2 million dollar park and a 2.8 million dollar park is often the difference between a marginal business and a very attractive one.
Breakeven should be recalculated whenever the cost structure changes materially, such as a rent escalation, a minimum wage increase, or an expansion of operating hours. The exercise also informs go or no-go decisions on promotions and new programs: a marketing campaign that drives incremental attendance at a contribution margin of 60 percent pays for itself at a much lower spend-to-revenue ratio than an operator without the framework would intuitively guess. Clear contribution margin thinking is one of the habits that distinguishes consistently profitable operators from perpetually stressed ones.
Sensitivity analysis turns a static breakeven point into a navigation tool. Running the model under three scenarios, a base case built on benchmark assumptions, a downside case with attendance 20 percent lower, and an upside case with attendance 15 percent higher, reveals which assumptions actually drive the outcome. In most park models, the variables with the largest impact are attendance, average per-capita spending, and labor as a percentage of revenue. Knowing which levers matter most lets operators focus their operational attention where it pays back, rather than spreading effort evenly across everything that can be measured. Investors and lenders respond well to operators who can speak fluently about how the business performs under stress.
Payback Period and EBITDA Benchmarks
The time required to recover the initial investment, known as the payback period, is the metric that most quickly captures investor attention. For well-executed family entertainment centers and trampoline parks, payback periods typically run 3 to 5 years. Parks with stronger-than-expected opening performance, favorable real estate terms, and disciplined cost control can achieve payback in as little as 24 to 30 months. Larger amusement and adventure parks, with higher upfront construction costs and more complex operations, generally require longer payback horizons in the 5 to 10 year range.
EBITDA margin, a proxy for operating profitability that sets aside interest, taxes, depreciation, and amortization, is the standard yardstick for comparing parks and judging the quality of earnings. Small family entertainment centers typically achieve EBITDA margins in the high teens, around 18 percent, while larger, better-run facilities push toward 22 percent or more. Major amusement parks, with their pricing power and scale, can target EBITDA margins of 30 percent and higher, with best-in-class destination parks reaching 40 percent or more. These ranges should anchor the operating assumptions in any pro forma and frame the conversation with lenders and equity partners.
The honest read on these benchmarks is that they are achievable but not automatic. Reaching a 22 percent EBITDA margin requires deliberate work on revenue mix, pricing, labor scheduling, and ancillary attachment. The difference between a park that clears 18 percent and one that clears 25 percent is rarely a single brilliant decision; it is the aggregation of dozens of small ones, made consistently over years, around the themes this book explores. For owners and investors, the practical lesson is to pressure-test every assumption in the model against these benchmarks, hold the plan accountable to realistic ranges, and build the operational habits that turn good numbers on paper into good numbers at the bank.
Financing structure deserves a brief mention because it sits between unit economics and enterprise economics. Most activity park projects combine owner equity, commercial bank debt, Small Business Administration loans, and in some cases equipment financing from vendors willing to spread the cost of trampolines or arcade machines over several years. A typical capital stack for a mid-size trampoline park might involve 25 to 35 percent owner equity, a senior loan covering 50 to 60 percent of the total, and equipment financing for the balance. Lenders generally want to see personal financial strength, industry experience, and a pro forma that demonstrates debt service coverage above 1.3 times in the first stabilized year. Structuring the capital stack thoughtfully can lower blended cost of capital, preserve operator optionality, and accelerate the path to meaningful cash distributions.
Exit value is the bookend to the investment story, and smart operators build the park with eventual sale or refinance in mind even if they plan to hold for decades. In private market transactions, family entertainment centers and trampoline parks commonly trade at 4 to 6 times trailing EBITDA, with larger portfolios and branded chains commanding higher multiples. A park that grows EBITDA from 400,000 dollars to 700,000 dollars over five years therefore creates enterprise value well beyond the incremental cash earned along the way. Every operational decision that lifts EBITDA quality, including diversified revenue, recurring membership income, and documented systems, compounds into the ultimate exit value and is a key reason the disciplines outlined in this chapter deserve the operator's ongoing attention.
Summary Points
✓Total investment ranges from roughly 200,000 dollars for a small FEC to several million for a mid-size activity park.
✓Equipment typically represents 30 to 50 percent of startup cost in action-oriented parks, making vendor negotiation a high-leverage activity.
✓Warehouse rental suitable for trampoline and climbing formats runs approximately 18 to 22 dollars per square foot annually in most North American secondary markets.
✓Healthy family entertainment centers generate 120 to 200 dollars of revenue per square foot per year, with top performers exceeding 200 dollars.
✓A working capital reserve of 5 to 10 percent of startup cost and a construction contingency of 10 percent (15 percent for complex builds).
✓Average revenue per capita for trampoline parks and FECs typically lands between 18 and 30 dollars, with food-forward operations trending toward the upper end.
PART VI: CONSTRUCTION AND LAUNCH
Part VI is about turning plans into a physical, licensed, and operational park ready to welcome guests. It covers site selection and lease negotiation, equipment procurement from credible suppliers, the permitting and construction sequence that produces a certificate of occupancy, and the pre-opening and staffing work that determines day-one guest experience. This is the phase where capital is most at risk and decisions are hardest to reverse. Operators who manage this phase with discipline open on time, on budget, and with a team already performing at standard.
There is a saying among veteran family entertainment center operators that you do not pick a site, you marry one. The lease an owner signs at this stage will outlive most employees, most pieces of equipment, and possibly several rebrands of the park itself. A favorable site at unfavorable terms can bleed a park of its operating margin year after year, while a less obvious building secured on smart terms can quietly produce extraordinary returns. This chapter walks through the discipline of finalizing the site, the structure of commercial leases, and the negotiating posture that separates tenants who survive their first lease cycle from those who do not.
By the time site selection enters its final stages, the broader feasibility study should already have narrowed the search to one or two metropolitan areas and a handful of trade zones within them. The work that follows is granular: comparing specific buildings, modeling the economics of each, conducting diligence on the property and the landlord, and converting a non-binding letter of intent into a fully executed lease. It is also the moment when the project transitions from a concept owned entirely by the founders to a partnership with a landlord, a municipality, and the contractors who will translate the lease into a finished space.
Site Due Diligence Checklist
Diligence on a candidate site begins long before lawyers draft a lease. The objective is to confirm that the building, the location, and the trade area can actually support the park modeled in the business plan. Demographics come first: a healthy activity park typically draws from a thirty-minute drive radius and benefits from a population dense in families with children under fifteen, with median household incomes that comfortably support discretionary entertainment spending. Operators who skip this step in favor of a flashy building inevitably discover that great real estate cannot manufacture customers.
The competitive landscape inside that radius is the second critical layer. Mapping every trampoline park, indoor playground, family entertainment center, bowling alley, and major arcade within a thirty-minute drive reveals where genuine market gaps exist and where a new park would simply be the fifth option in a saturated trade zone. Counting competitors is not enough; their pricing, attractions, online reviews, and apparent vintage all factor into whether a new entrant can claim a meaningful share of local play occasions. A market with two tired, aging competitors often presents a stronger opportunity than a market with one shiny new park.
Destination traffic should also be evaluated carefully, especially when considering major malls, mixed-use centers, and tourism-driven properties. Large destination projects can generate enormous traffic for strong park concepts because they already concentrate families, tourists, dining, shopping, events, and entertainment in one place. Mall of America is one of the clearest U.S. examples: its official website reports 32 million annual visitors from around the world and more than 300 events per year, generating over $3 billion in annual economic impact for Minnesota. American Dream in New Jersey provides another useful example of destination positioning: its official leasing page describes the property as having three major airports nearby, over 20 million local residents, and the status of the top retail and entertainment destination in America’s top market. For indoor activity park operators, the lesson is that the best sites are not only near families; they are embedded in places where families already choose to spend time, celebrate birthdays, attend events, eat, shop, and look for memorable experiences.
Visibility, accessibility, and parking shape day-to-day economics in ways that landlords rarely advertise. A site that is invisible from the nearest arterial road effectively forces the operator to buy attention through paid media every month. Easy ingress and egress, signage rights, and a parking ratio of at least five spaces per thousand square feet of leased area materially reduce friction for first-time visitors and for parents juggling toddlers, party supplies, and birthday gifts. Sites tucked behind office complexes or buried at the back of a power center can work, but the rent should be priced accordingly.
Zoning and code verification come before any money changes hands. A municipality's planning department must confirm that the property is approved for commercial recreation, indoor amusement, or whatever specific use category applies in that jurisdiction. Some cities place activity parks under conditional use permitting, which adds public hearings and elected-official discretion to the timeline. Building code reviews are equally important: ceiling clear height, sprinkler density, occupancy load, accessible restroom counts, and electrical service can each disqualify a building or add hundreds of thousands of dollars to the buildout if discovered late.
Physical due diligence rounds out the checklist. A structural engineer should confirm that the slab and roof can carry the dynamic loads imposed by trampoline rigs, ninja obstacles, and rope courses. Mechanical, electrical, and plumbing systems must be assessed for capacity, age, and the cost of bringing them up to the demands of a high-occupancy attraction. Environmental reports verify that the site is not encumbered by legacy contamination, and a roof inspection prevents an unexpected capital expense in year two of the lease. Every issue uncovered in diligence becomes leverage in the lease negotiation that follows.
Lease Negotiation Strategy and Posture
A commercial lease is a long-term, legally binding contract that is rarely a fair fight on the first draft. The landlord's standard form is written by the landlord's lawyer for the landlord's benefit, and almost every clause is negotiable for tenants who know to ask. The single most cost-effective decision an owner can make at this stage is to retain a commercial real estate broker who represents tenants exclusively and a lawyer who specializes in commercial leases. Both fees are modest compared with the savings they generate over a ten-year term.
Negotiating posture matters as much as the line items. Landlords expect counteroffers and price their asking rents accordingly, often anticipating reductions of ten to fifteen percent before reaching a deal. Tenants who accept the first proposed terms signal inexperience and forfeit value across the entire agreement. The best negotiators come prepared with comparable lease data from the same trade area, a clear understanding of the landlord's vacancy and debt situation, and a willingness to walk away if the deal cannot be made to work. A second viable site, even one slightly less preferred, is the single most useful piece of leverage at the table.
Timing is another quiet source of leverage. Landlords with quarter-end leasing targets, large blocks of vacancy, or pending refinancing events tend to be more flexible than those with full buildings and patient capital. Operators who can move quickly on diligence and decision-making, and who present themselves as well-capitalized and operationally credible, win concessions that less prepared tenants are denied. The lease negotiation is the first real test of whether the project's leadership can run a complex transaction; landlords notice.
Key Lease Terms: Rent, CAM, Percentage Rent, and Term Length
Commercial leases vary widely in how rent and operating expenses are divided between landlord and tenant. The triple net lease, common in retail and standalone buildings, charges a base rent plus the tenant's share of property taxes, building insurance, and common area maintenance. The structure offers transparency and tends to produce lower base rents, but it also exposes the tenant to year-over-year fluctuations that can erode budget discipline if not capped. Gross leases bundle most expenses into a single rent number, simplifying budgeting at the cost of less visibility into the underlying drivers. Modified gross leases sit in between, with tenant and landlord splitting specific categories of expense.
Percentage rent leases are common in regional malls and lifestyle centers and increasingly relevant for activity parks in mixed-use developments. Under this structure the tenant pays a base rent plus a percentage of gross sales above a defined breakpoint. The breakpoint is typically calibrated so that the landlord begins to share in upside only after the tenant has covered base rent through normal operations. This alignment can be attractive in trade zones where the landlord is actively driving traffic, but operators must scrutinize how gross sales are defined, whether party packages and prepaid memberships are included, and how often percentage rent is reconciled.
Common area maintenance charges deserve their own line of scrutiny. CAM clauses often quietly include categories that have nothing to do with maintenance, including landlord administrative fees, capital improvements that should remain the landlord's responsibility, and pass-throughs for landlord negligence. Sophisticated tenants exclude these categories explicitly, demand audit rights, and negotiate annual caps on controllable CAM increases of three to five percent. Without these protections, a tenant can find that effective rent has crept up by twenty percent over five years even when the base rent number on the cover page has barely moved.
Term length is a balancing act between flexibility and stability. A short initial term of three years preserves optionality if the concept underperforms or the trade area shifts, but landlords generally respond by raising base rent and reducing tenant improvement allowances. A longer term of seven to ten years with multiple renewal options at predetermined rents generally produces better economics for operators confident in their model. Renewal options are essentially free during initial negotiation and become extraordinarily valuable later, when a successful park has built local equity that would be expensive to abandon.
Annual escalations should be capped and clearly defined. A flat two to three percent annual increase is standard; tying escalations to the consumer price index without a ceiling exposes the tenant to inflation shocks that have become more frequent in recent years. Tenants can sometimes negotiate stepped rent during the first eighteen to twenty-four months, recognizing that the park is still ramping toward stabilization and cash flow is constrained by the demands of opening.
Tenant Improvement Allowances and Landlord Contributions
The tenant improvement allowance is the single largest landlord contribution most activity park operators ever receive, and it is highly negotiable. The allowance is typically expressed as a dollar figure per square foot of leased area, paid either as direct funding to the contractor on milestone completion or as a rent credit amortized over the term. For activity parks, which require extensive structural reinforcement, electrical upgrades, dedicated HVAC capacity, and specialized flooring, allowances in the range of thirty to seventy-five dollars per square foot are common in well-negotiated deals, with higher numbers achievable in markets where the landlord has significant vacancy or sees the park as an anchor that will pull traffic to neighboring tenants.
The allowance should be evaluated alongside the base rent rather than in isolation. Landlords typically recover the cost of the allowance through higher rent, often calculated as an effective interest rate of eight to ten percent over the lease term. A larger allowance with slightly higher rent often makes more sense for an operator preserving precious working capital for equipment and pre-opening expenses. The key is to make sure the math is transparent and that the tenant retains control over how the funds are spent within agreed-upon categories.
Landlord contributions can extend beyond the headline allowance. Free rent during the buildout period, sometimes called fixturing time, lets the tenant complete construction without paying for an unfinished space. Contributions toward signage, monument visibility upgrades, and shared facade improvements often live in separate clauses and can be worth tens of thousands of additional dollars. Tenants should also negotiate the right to draw down the allowance against soft costs such as architectural fees and permitting, not just hard construction, since these expenses often consume more of the budget than first expected.
Exclusivity Clauses, Radius Restrictions, and Co-Tenancy
An exclusivity clause prevents the landlord from leasing space in the same property to a direct competitor. For activity parks anchored in shopping centers or mixed-use developments, this protection is essential. Without it, a landlord can introduce a competing trampoline park, indoor playground, or family entertainment center one storefront away once the original tenant has done the hard work of establishing the trade area as a destination. The exclusivity language should be specific enough to cover the actual competitive threat and broad enough to anticipate adjacent concepts that might compromise the park's positioning.
Radius restrictions sometimes appear in leases as a constraint on the tenant rather than the landlord. These clauses bar the tenant from opening a second location within a defined radius, typically three to ten miles. For first-time operators planning a single park this is rarely binding, but for franchisors and multi-unit developers the clause can prevent the natural expansion plan that justified the original investment. Negotiate the radius down, exclude existing locations, and seek explicit permission for future units in different submarkets.
Co-tenancy clauses protect the tenant if the property loses key anchor tenants or falls below an occupancy threshold. In a mall environment, the loss of a department store anchor can cut foot traffic by thirty percent overnight, which fundamentally alters the economics that justified the lease. A well-drafted co-tenancy clause allows the tenant to pay reduced rent or terminate the lease entirely if specific co-tenants leave or if total occupancy drops below an agreed level. Landlords resist these clauses but increasingly accept them as standard in entertainment-oriented leases.
Kick-Out Provisions and Termination Rights
A kick-out clause gives the tenant the right to terminate the lease early if performance falls below a defined threshold, typically a sales floor measured at the end of the third or fourth year. The clause is a powerful safety valve for first-time operators who have realistic concerns about untested trade areas. The negotiated terms usually require the tenant to pay a termination fee covering the unamortized tenant improvement allowance and a portion of remaining rent, but this is far cheaper than carrying an underperforming park to lease end.
Other early termination rights deserve attention as well. Landlord default clauses should give the tenant clear remedies if the landlord fails to maintain the property, deliver promised improvements, or complete agreed-upon work. Subleasing and assignment rights provide an exit if the business needs to be sold or if the operator wishes to convert to a franchise model. Personal guarantees, which many landlords request as a default, should be resisted vigorously and, if accepted at all, should be limited in time and dollar amount with a clear burn-off schedule.
Purchase Versus Lease Economics
Most activity park operators lease rather than buy, but the purchase question deserves a serious evaluation when the right opportunity appears. Owning the building eliminates rent escalation risk, captures real estate appreciation, and provides flexibility to modify the space without landlord approval. It also allows the operator to separate the real estate and operating businesses, holding the property in a separate entity that leases to the operating company at market rent. This structure is common among multi-unit operators and creates meaningful tax planning opportunities.
The downside of ownership is the capital required. A typical activity park building can cost five to fifteen million dollars to acquire, and even with seventy-five percent debt financing, the equity requirement crowds out investment in equipment, marketing, and working capital. For most first-time operators the better path is to lease initially, prove the concept, and revisit ownership when expanding to additional units. Sale-leaseback transactions and ground leases with purchase options can bridge the gap for operators who want eventual ownership without the upfront capital requirement.
Landlord Coordination During Buildout
Once the lease is signed, the landlord becomes a critical partner in the construction process. Most leases require landlord approval of the architectural plans, the general contractor, and any work that affects building systems or shared infrastructure. A well-managed tenant coordinator on the landlord's side accelerates approvals, while a disengaged or overloaded coordinator can introduce weeks of delay into the schedule. Establishing direct communication with the tenant coordinator early, and treating that relationship as a true partnership, pays compounding dividends throughout the buildout.
Coordination touches dozens of practical details that the lease cannot fully anticipate. Construction access to the loading dock, elevator reservations for equipment delivery, dust control during business hours in occupied properties, and sequencing of utility shutdowns all require active dialogue. In shopping centers, the landlord typically imposes design review standards that must be met before permits can be pulled, including signage colors, storefront materials, and exterior lighting. Operators who treat landlord requirements as adversarial obstacles spend weeks fighting battles that cooperative tenants resolve in days.
Timeline From Lease Signing to Opening
The typical timeline from a fully executed lease to a grand opening runs nine to fifteen months for an activity park, with the exact length determined by the building's existing condition, the complexity of the attractions package, and the responsiveness of the local permitting authority. A second-generation space that previously housed a similar use can sometimes open in seven to eight months, while a true shell space in a new development routinely takes a full year or more. Operators planning their first park should budget toward the longer end of this range and treat any acceleration as upside rather than as the base case.
A realistic schedule allocates roughly two to three months to architectural design and engineering, one to three months to permitting, four to six months to active construction, and one to two months to equipment installation, staff training, and soft opening. Many of these phases overlap when managed well, but each has a critical path component that cannot be compressed without risking quality or safety. The opening date that ultimately matters is the one supported by complete certificate of occupancy approvals, fully trained staff, and stable operating systems, not the one chosen for marketing reasons six months earlier.
Within that overall envelope, the timeline rarely runs in a clean linear sequence. Permit reviews come back with comments that require revisions and resubmission, equipment shipments arrive ahead of or behind schedule, and the discovery of an unexpected condition behind a wall can add weeks to the framing phase. Building two to three weeks of float into each major phase is not pessimism; it is engineering. Operators who set artificially aggressive opening dates to satisfy investors or marketing consultants find themselves either pushing the date publicly or, worse, opening before the park is ready and absorbing months of operational damage that would have been avoided by patience.
Pre-opening expenses also follow a predictable curve through this timeline. Architectural and engineering fees front-load the early months, hard construction costs dominate the middle, and a final wave of pre-opening expense, including staff training payroll, soft opening costs, and initial marketing, accelerates in the final eight weeks before opening. Cash flow forecasting should map these expenses against the funding plan from Part V, with a clear answer to the question of which dollars fund which expense category. Financing structures often disburse in tranches tied to construction milestones, and the operator must ensure that the cash always arrives before the bills do.
Summary Points
✓Site selection is anchored in demographics, competition, visibility, parking, and zoning, with diligence completed before any binding commitment.
✓Engage a tenant-side broker and a commercial lease attorney. both fees are dwarfed by the value they generate over a ten-year term.
✓Triple net, gross, modified gross, and percentage rent structures each shift different risks. understand the math behind the headline rent.
✓Scrutinize CAM definitions, demand audit rights, and cap controllable expense increases at three to five percent annually.
✓Term length is a tradeoff between flexibility and stability. renewal options are nearly free at signing and extraordinarily valuable later.
✓Tenant improvement allowances of thirty to seventy-five dollars per square foot are achievable for activity parks in well-negotiated deals.
Equipment is the single largest line item in most activity park budgets and the single most visible expression of the brand on opening day. Trampolines, ninja obstacles, soft play structures, climbing walls, and interactive technology together can consume thirty to forty percent of total project capital, and the choices made during procurement will define the guest experience, the safety profile, and the maintenance burden of the park for the next decade. This chapter walks through how to evaluate suppliers, navigate global safety standards, decide between custom and off-the-shelf solutions, and structure procurement in a way that protects the operator long after the equipment trucks have left.
Procurement is also where many first-time operators get into the most trouble. The temptation to chase the lowest quoted price is enormous, especially when capital is tight and equipment lists run long. The discipline that separates successful parks is recognizing that the cheapest trampoline frame becomes the most expensive piece of equipment in the building once it starts producing injuries, lawsuits, downtime, and replacement orders within the first eighteen months. Equipment procurement is a safety decision, an operations decision, and a brand decision wrapped together, and only secondarily a price decision.
Supplier Evaluation Criteria
A reputable equipment supplier earns trust across four dimensions: engineering credibility, manufacturing quality, lifecycle support, and commercial reputation. Engineering credibility is demonstrated through stamped engineering calculations, documented compliance with recognized standards, risk assessments such as failure modes and effects analysis, and a willingness to share these documents transparently with the buyer. Suppliers who treat technical documentation as proprietary or who cannot produce it on request are signaling that the engineering rigor behind their products may not survive third-party scrutiny.
Manufacturing quality is best verified through a factory audit, conducted either in person or virtually through a structured video walkthrough. The audit should examine raw material certifications, welding procedure records, anti-corrosion treatments, in-process inspection logs, and final factory acceptance testing protocols. Suppliers who carry ISO 9001 quality management certification have committed to a defined quality system, and third-party certifications from bodies such as TÜV SÜD provide an additional layer of independent verification. None of these certifications guarantee quality on its own, but their absence is a meaningful warning sign.
Lifecycle support is what separates an equipment vendor from a long-term partner. The ideal supplier offers installation supervision, on-site operational training for park staff, detailed maintenance manuals, recommended spare parts kits, and a clear escalation path for warranty claims and emergency repairs. Operators should ask for the supplier's typical response time on safety-critical issues and request references from existing customers willing to discuss how the supplier behaves when problems arise. Suppliers who only show up to make sales and disappear after delivery should be eliminated from consideration regardless of price.
Commercial reputation is established through track record, industry presence, and reference checks. A supplier with at least five years of operating history, an active membership in industry associations such as IAAPA, and a verifiable list of installed parks provides a meaningful baseline. References should be drawn from parks that opened at least twelve months prior, since equipment problems often surface only after the first year of heavy use. Online operator forums, franchise networks, and the informal grapevine among park owners are invaluable sources of unfiltered feedback that no glossy supplier brochure will ever provide.
Equipment Categories and Their Distinct Considerations
Modern activity parks typically combine several equipment categories, each with its own engineering requirements, supplier landscape, and maintenance profile. Trampoline systems anchor most parks and include open jump courts, foam pits, slam dunk lanes, dodgeball courts, and angled wall trampolines. Commercial-grade systems require heavy steel frames typically two to three millimeters thick, redundant high-tension springs, fire-resistant padding covering all hard surfaces, and continuous safety netting around perimeters and over framework. Off-brand consumer-grade trampolines have no place in a commercial park and represent a near-certain liability event.
Ninja obstacle courses have evolved from a niche offering into a core attraction in many newer parks. The category includes warped walls, salmon ladders, cliffhanger ledges, and a wide range of branded apparatus inspired by televised ninja competitions. These attractions involve significant fall heights and dynamic loads, making engineering rigor and impact-attenuating flooring beneath every obstacle non-negotiable. Soft play structures, by contrast, target the toddler and young child demographic and rely on padded foam, slide systems, ball pits, and sensory elements engineered for comparatively low fall heights but high cleaning and infection-control requirements.
Climbing walls, rope courses, and sky trails require specialized engineering for fall protection systems, including auto-belay devices, harness inventories, and inspection regimes that often involve annual recertification by the manufacturer. Interactive technology elements, including projection-based floor games, ball-throwing arcades, augmented reality climbing walls, and sensor-equipped trampolines, introduce a different set of considerations centered on software updates, network reliability, and ongoing licensing fees. Each category benefits from a supplier that has proven expertise in that specific domain rather than a generalist that dabbles across all of them.
Domestic Versus International Sourcing
The supplier landscape for activity park equipment is genuinely global, with significant manufacturing capacity concentrated in North America, Western Europe, and Asia. Domestic suppliers typically offer shorter lead times, easier site visits, simpler warranty enforcement, and stronger alignment with local code requirements, but at price points twenty to forty percent above comparable international alternatives. Operators who value schedule certainty, the ability to inspect in person before shipment, and rapid post-installation support often find the premium worthwhile, particularly for first-time projects.
International sourcing, particularly from established Chinese and European manufacturers, can deliver compelling value but requires more sophisticated procurement discipline. Total landed cost must include ocean freight, customs duties, currency hedging, inland transportation, and the inevitable delays that accompany any international shipment. Quality verification before shipment becomes essential because resolving defects after equipment has cleared customs in the destination country is expensive and slow. Operators sourcing internationally should engage a third-party inspection firm to conduct factory acceptance testing before goods leave the origin port.
Hybrid sourcing strategies are increasingly common. Many parks combine internationally sourced trampoline frames and structural steel with domestically produced soft goods, padding, and digital interactive elements. This approach captures the cost advantages of global manufacturing where they are most pronounced while preserving local supply chains for components that benefit from proximity, rapid iteration, or shorter wear cycles. The key is to maintain a single point of accountability for safety and warranty, even when components flow from multiple sources.
Custom Versus Off-the-Shelf Design
Off-the-shelf equipment packages are faster, cheaper, and lower risk. Established suppliers offer predefined court layouts, ninja obstacle assortments, and soft play configurations that have been engineered, code-tested, and proven across dozens or hundreds of installations. For operators prioritizing speed to market and bankable budgets, off-the-shelf is the right answer roughly eighty percent of the time. The packages can still be customized in finishes, color schemes, branding, and specific mix of attractions without invoking the cost and complexity of true custom engineering.
Custom design is appropriate when the building geometry is unusual, when the brand concept demands a differentiated guest experience, or when the operator is targeting a premium positioning that off-the-shelf packages cannot deliver. Custom work introduces longer engineering timelines, higher costs, and additional approval cycles with code authorities who may not have seen the configuration before. It also creates intellectual property ownership questions that should be addressed in the supplier contract. Done well, custom design produces signature attractions that anchor marketing and create genuine local distinctiveness.
Safety Certifications: ASTM, EN, and Beyond
Safety certification is the language through which manufacturers demonstrate that their equipment has been engineered to recognized standards. In the United States, the ASTM F24 committee maintains the primary suite of standards covering amusement rides and devices, including F2291 for design, F1193 for manufacturing, and F770 for operation. Trampoline courts specifically fall under ASTM F2970, which addresses design, manufacture, installation, and operation of commercial trampoline parks. Equipment that does not meet these standards may not be insurable in the United States and creates significant liability exposure regardless of jurisdiction.
European operators and many international suppliers reference EN 13814, the European standard for the safety of amusement rides and devices. EN 13814 mandates detailed engineering analysis, material verification, and risk assessments, and many global suppliers design to both ASTM and EN standards simultaneously to maximize the addressable market for their products. Local code authorities in some jurisdictions have additional layered requirements; for example, several U.S. states have adopted specific trampoline park licensing regimes that require third-party inspection on top of standard compliance.
Beyond the headline standards, several adjacent certifications add meaningful credibility. ISO 9001 covers the supplier's quality management system, ISO 14001 addresses environmental management, and specific component certifications cover items such as the impact attenuation of foam pits and the load ratings of climbing harnesses. The single most important step an operator can take is to require, in writing, that the supplier deliver complete certification documentation as a condition of final payment, with copies provided directly to the insurance carrier and the local code authority.
Installation, Testing, and Warranty Structure
Equipment installation should always be supervised by the manufacturer's technicians, even when local general contractors handle the underlying construction work. Installation supervision ensures that components are assembled in the exact sequence specified, that torque values and tension settings meet engineering specifications, and that any field modifications are documented and approved. Self-installed equipment, regardless of how clear the manuals appear, voids warranties at most reputable suppliers and creates an evidentiary nightmare in the event of a future incident.
Acceptance testing follows installation and serves as the formal handoff from supplier to operator. The testing protocol should include load testing of all dynamic elements, verification of safety netting tension, inspection of every weld and fastener, calibration of any sensor or interactive systems, and documented training of operations staff on daily inspection procedures. The acceptance testing report becomes a foundational document for ongoing maintenance and for any future incident investigation, and it should be archived with the same care given to construction permits and lease agreements.
Warranty structures typically span twelve months on labor and one to five years on structural components, with consumable items such as springs, mats, and pads warranted for shorter periods. Operators should negotiate explicit response times for warranty claims, particularly for safety-critical components, and should reject warranty language that requires the operator to pay for shipping or labor on covered repairs. Extended warranty and preventive maintenance contracts are worth considering for high-wear systems, especially in busy markets where downtime carries significant revenue impact.
Spare Parts Planning and Maintenance Contracts
Spare parts inventory is the unsung hero of operational reliability. A trampoline park that loses three courts because a regional supplier is back-ordered on springs is a trampoline park losing ten thousand dollars in revenue per day. The initial equipment order should include a recommended spare parts package covering springs, mats, padding, fasteners, and any specialty components with long lead times. The package adds meaningfully to the upfront cost but pays for itself the first time a busy Saturday is preserved by a part already on the shelf.
Ongoing maintenance contracts with the equipment manufacturer fall into two categories. Preventive maintenance contracts schedule periodic inspections and component replacements at defined intervals, preserving warranty coverage and catching wear issues before they become safety incidents. On-call maintenance agreements provide guaranteed response times for emergency issues, often at premium rates but with valuable certainty. Many operators combine both, using a primary preventive contract for scheduled work and an on-call agreement for unplanned events. Either way, the operator should also build internal maintenance capability through training and a dedicated technician, since the most responsive supplier is the one already standing in the building.
Insurance and Liability Implications
Equipment selection cascades directly into the insurance program that the park will carry from the day doors open. Insurance underwriters increasingly demand documentation of equipment certifications, supplier credentials, and inspection regimes before issuing general liability and excess coverage at competitive rates. Operators who buy non-compliant or undocumented equipment often discover, late in the process, that their best insurance quotes have evaporated and that the remaining options carry premiums and exclusions that materially impair the financial model. Bringing the insurance broker into supplier conversations early aligns underwriting expectations with procurement decisions.
Premium pricing is meaningfully sensitive to a small number of factors: the specific attractions in the mix, the supplier's track record, the operator's claims history if applicable, the staff training regime, and the documented inspection program. Two parks with identical revenue and identical floor plans can pay insurance premiums that differ by fifty percent or more based on these inputs. The highest-leverage moves are typically choosing reputable suppliers with strong claims data, requiring manufacturer-supervised installation, and instituting a documented daily inspection program from opening day.
Summary Points
✓Equipment is the single largest line item and the most visible expression of brand quality on opening day.
✓Evaluate suppliers across engineering credibility, manufacturing quality, lifecycle support, and commercial reputation.
✓Demand stamped engineering calculations, factory audits, and ISO 9001 or third-party certifications such as TÜV SÜD.
✓Trampolines, ninja courses, soft play, climbing systems, and interactive technology each require category-specific expertise.
✓Domestic sourcing offers schedule certainty. international sourcing can deliver value but requires disciplined procurement and pre-shipment inspection.
✓Off-the-shelf packages cover most needs. reserve custom design for unusual buildings or premium positioning.
If site selection is the marriage and equipment procurement is the wedding registry, permitting and construction is the long honeymoon during which a hundred small decisions either build a foundation for years of smooth operation or quietly accumulate into a punch list that haunts the park for its first two years. This chapter walks through the regulatory framework that governs the buildout, the team that will deliver it, the schedule that will determine the opening date, and the management discipline required to bring it all in on time and on budget.
Activity park construction is meaningfully more complex than a standard retail buildout. The structural reinforcement required for trampoline rigs, the ceiling clearances dictated by climbing elements, the dedicated mechanical capacity needed for high-occupancy spaces, and the specialty flooring beneath every attraction together create a project that resembles a hybrid between a fitness center, a concert venue, and a school gymnasium. The general contractor and architect chosen for the job should have either direct experience with similar projects or a demonstrated willingness to partner closely with the equipment supplier and the design consultants who do.
The Permitting Roadmap
Permitting begins long before construction and extends past the certificate of occupancy. The work starts with confirming the legal entity that will hold the lease and the permits. Most operators form a limited liability company specifically for the park, separating personal assets from the operating business and creating a clean structure for future financing or partnership transactions. The entity must obtain a federal employer identification number, register for state sales tax, and complete any additional state-level entity filings before applying for local permits in its name.
Local permitting typically begins with zoning verification, which confirms that the property's zoning category permits commercial recreation or amusement uses. Some jurisdictions require a conditional use permit, which adds a public hearing and possibly a vote by elected officials. Building permits follow, with the local building department reviewing structural, mechanical, electrical, and plumbing plans for compliance with the applicable codes. Fire department review is parallel and sometimes dominant, covering occupancy load, exit width, sprinkler density, and emergency lighting. Health department permits apply if the park serves food and beverages, and many municipalities also require specific amusement or entertainment licenses for businesses operating arcades, climbing walls, or trampoline courts.
The certificate of occupancy is the final approval that converts a construction site into a place of public assembly. Issued by the building department after a series of final inspections, the certificate confirms that the space is safe for its intended use and that all building, fire, and code requirements have been met. The process from final inspection request to issued certificate typically takes four to eight weeks, longer in jurisdictions with backlogs. Operators should treat the certificate of occupancy date as the true opening date for planning purposes, with the public grand opening scheduled at least two weeks after the certificate is firmly in hand.
Working With Architects and Contractors
The design and construction team is selected through a process that should begin shortly after the letter of intent is signed and well before the lease is fully executed. The architect leads the design phase, translating the operating concept and equipment package into stamped construction documents. The right architect for an activity park has either prior experience with similar projects or a willingness to learn, and brings a structural engineer, mechanical engineer, and lighting designer who together form a coherent team. Operators should interview at least three firms, request portfolios of completed entertainment projects, and check references with prior clients about responsiveness and budget discipline.
The general contractor delivers the construction work and manages the subcontractors who execute it. Selection should follow a competitive bid process based on a complete set of construction documents, with at least three qualified contractors invited to bid. Lowest price is not the right selection criterion; the right contractor combines competitive pricing, demonstrated experience with similar projects, financial stability, a clean safety record, and a project manager personally committed to the job. Reference checks with prior clients, focused specifically on schedule performance and change order behavior, are the single most useful diligence step.
The contract with the general contractor should be structured to align incentives. Guaranteed maximum price contracts protect the owner from cost overruns within the defined scope, while shared savings clauses give the contractor a meaningful incentive to deliver under budget. Cost-plus contracts are appropriate only when the scope is genuinely uncertain at signing and should include clear caps and audit rights. Whatever the contract structure, the owner should retain a third-party project manager or owner's representative to monitor progress, validate change orders, and manage the relationship between architect, contractor, and equipment suppliers.
Construction Timeline and the Critical Path
An activity park buildout follows a critical path that runs from architectural design through final inspection. The major sequence begins with design development and engineering, typically two to three months of work that produces stamped permit drawings. Permit application and approval follows, consuming one to three months depending on jurisdiction and project complexity. Site preparation and demolition begin once permits are in hand and are followed by structural work and interior framing, mechanical and electrical rough-in, attraction and equipment installation, interior finishes, and finally a series of inspections culminating in the certificate of occupancy.
The critical path identifies the sequence of tasks that determines the project's minimum duration. Any delay to a task on the critical path delays the opening date directly, while delays to non-critical tasks can often be absorbed without affecting the schedule. For activity parks, the critical path typically runs through structural reinforcement, equipment delivery, and final inspections, with particular sensitivity to long-lead items such as imported attractions and specialty steel. Understanding which tasks sit on the critical path turns schedule management from a guessing game into a focused discipline.
Realistic timeline planning recognizes that some phases can run in parallel while others cannot. Mechanical, electrical, and plumbing rough-in often runs concurrently with framing and structural work, but interior finishes generally cannot begin until rough-in inspections are complete. Equipment installation requires a clean, finished surface beneath each attraction and must be sequenced after flooring is installed. The architect, general contractor, and equipment suppliers must build a single integrated schedule that the owner reviews weekly, with clear milestone dates and named owners for every task.
Managing the Buildout Day to Day
The owner's role during construction is governance, not micromanagement. Weekly project meetings, supplemented by daily progress reports, give the owner visibility into schedule, budget, and quality without descending into the contractor's territory. Construction management software has matured to the point where photo logs, RFIs, change orders, and inspection results can all be tracked in real time, and operators should insist on a single shared platform that all parties update consistently. The platform becomes the project's institutional memory and survives the inevitable personnel changes that occur on any twelve-month project.
Change orders are the single largest source of cost overruns and schedule slippage on most construction projects, and an activity park is no exception. A disciplined change order process requires written documentation of every requested change, an estimate of cost and schedule impact, and explicit owner approval before work proceeds. Field changes, in which a contractor or subcontractor makes a modification without formal approval, should be rejected on principle and remedied at the contractor's expense. Owners who allow field changes to drift into the project teach their team that the change order process is optional, with predictable consequences.
Common Delays and Mitigation Strategies
Construction delays are almost always traceable to a small number of recurring causes. Design changes introduced after permit approval are the most common, often because the owner discovered something during construction that could have been resolved during design. The mitigation is rigorous design review before permit submission, ideally with a model walkthrough that exposes spatial conflicts and operational concerns while changes are still inexpensive. Permitting backlogs are the second leading cause, and the mitigation is complete and accurate documentation, early engagement with code authorities, and the engagement of an expediter familiar with the local department's preferences.
Labor and material shortages have become a structural feature of post-pandemic construction markets. Lead times for specialty steel, custom millwork, and imported attractions have stretched in many regions, and the mitigation is early procurement, deposit-secured orders, and contingency planning for alternative suppliers. Subcontractor performance issues are a third major source of delay, mitigated through careful vetting before contract award, payment structures that withhold meaningful retainage until completion, and a willingness to replace underperformers before their issues compound into schedule emergencies.
Communication breakdowns silently produce a surprising share of construction delays. When the architect, contractor, equipment supplier, and landlord each operate from different versions of the schedule, decisions made by one party invalidate the assumptions of another. The mitigation is a single shared communication platform, weekly coordination meetings with all stakeholders present, and a designated owner's representative whose primary job is ensuring that information flows correctly between parties. Inclement weather is the one cause that genuinely cannot be controlled, and the mitigation is buffer days built into the schedule and a site security plan that protects materials from damage.
Inspections, Punch Lists, and Quality Control
Inspections punctuate the construction schedule from foundation through final approval. Each major trade typically requires a series of inspections at specific milestones, including foundation pre-pour, framing rough, mechanical and electrical rough, and final completion. The general contractor manages the inspection schedule, but the owner should track upcoming inspections and ensure that the contractor is genuinely ready when the inspector arrives. Failed inspections produce delay, extra fees, and reputation damage with the local code authority that lingers across multiple projects.
The punch list emerges in the final weeks of construction and lists every defect, omission, and incomplete item that the contractor must resolve before final acceptance. A thorough punch list, typically produced jointly by the architect, owner, and contractor, runs to dozens or hundreds of items in a complex activity park buildout. The owner should withhold final retainage, typically five to ten percent of the contract value, until every punch list item is resolved to the architect's satisfaction. Items deferred past opening day rarely get completed, regardless of the contractor's promises at the time.
Quality control extends beyond the punch list into the systematic verification that the building performs as designed. Mechanical systems should be commissioned by a qualified commissioning agent who tests airflow, temperature setpoints, and system response under load. Acoustical performance, lighting levels, and sound system coverage all benefit from formal commissioning before the public arrives. The modest cost of a commissioning consultant is repaid quickly through reduced operating issues and lower energy consumption over the life of the lease.
Coordination With Equipment Installation
Equipment installation is the most complex orchestration in the buildout. The major attractions typically arrive in a sequence dictated by their installation requirements, with the largest and most structural items installed first and the smaller, finish-sensitive items installed last. The general contractor must complete flooring, painting, and lighting in each zone before equipment installation can proceed in that zone, while the equipment installation crew often requires exclusive access to the space during their work. Sequencing errors produce costly idle days for one team or the other.
The integrated schedule should specify, week by week, which equipment is being installed, which areas are clean and ready, and which subcontractors retain access to which zones. Daily coordination meetings during the installation phase, even if brief, prevent the misunderstandings that otherwise consume hours of rework. The owner should also confirm that all utilities, networking, and structural support are in place before the equipment installation crew arrives. A team that flies in from another country to install a trampoline rig and discovers that the floor is not yet poured represents a catastrophic scheduling failure that costs tens of thousands of dollars.
Final Walk-Through and Handover
The final walk-through is the formal moment when the building changes hands from contractor to owner. Conducted jointly by the owner, architect, general contractor, and key subcontractors, the walk-through verifies that all punch list items are complete, all systems are commissioned, all permits and certifications are in hand, and all warranty documentation has been transferred. The walk-through produces the final acceptance letter that releases retainage and triggers the start of warranty periods on equipment and building systems.
Beyond the formal handover, the final walk-through is the owner's last opportunity to identify issues before paying customers begin to use the space. Operations leadership should walk through with the construction team, mentally rehearsing how staff and guests will move through the space, where lines will form, where strollers will park, and how emergency egress will function under full load. Issues identified during this walk-through can often be resolved during the soft opening period; issues discovered after grand opening tend to live with the park for years.
Budget Discipline During Construction
Cost overruns on activity park buildouts trace back to a small number of recurring patterns: scope creep introduced through informal change orders, optimistic original budgets that left no contingency for the inevitable surprises, and weak governance around vendor approvals and supplier substitutions. A disciplined budget includes an explicit construction contingency of ten to fifteen percent of the hard cost number, separately tracked and released only against approved changes. Owners who treat the contingency as a discretionary rainy day fund typically end up exceeding the total budget rather than preserving it.
Monthly budget reconciliation is the single most useful financial discipline during the buildout. The general contractor's pay applications, the architect's fees, the equipment supplier invoices, the permitting and consulting expenses, and the pre-opening soft costs all flow into a single budget tracker that reports actual against budget for every category. Variances are explained, not papered over, and trends are addressed before they become emergencies. The discipline also prepares the operator for the financial reporting expectations of lenders and investors, who will continue to expect this level of rigor long after the doors open.
Summary Points
✓Activity park construction is materially more complex than standard retail and demands experienced architects and contractors.
✓Permitting touches zoning, building, fire, health, and amusement licensing. the certificate of occupancy is the true opening gate.
✓Form the legal entity early, secure federal and state IDs, and maintain consistent naming across permits and the lease.
✓Select the architect and general contractor through competitive processes, weighing experience and references over the lowest bid.
✓Use guaranteed maximum price contracts where possible and retain an owner's representative to govern the project.
✓The critical path runs through structural work, equipment delivery, and final inspections. build the master schedule around it.
A finished building is a stage; the staff is the cast. Every interaction guests have with an activity park, from the moment a parent calls to ask about birthday party availability to the final wave at the exit door, is mediated by people whose performance was shaped weeks or months earlier through hiring, training, and pre-opening preparation. This chapter walks through the human infrastructure that determines whether opening day produces enthusiastic five-star reviews or apologetic refunds. The discipline begins with organizational design, runs through recruitment and training, and culminates in the soft opening sequence that bridges construction to commercial operation.
Pre-opening is also the phase in which most first-time operators discover that running an activity park is fundamentally a hospitality business that happens to have trampolines in it. Guests notice the smile at the front desk before they notice the latest ninja obstacle, and they remember the staff member who solved their problem long after they have forgotten the price of admission. Building this culture from the first day requires intention, investment, and a leadership team that models the behaviors expected of everyone else.
Organizational Structure
A typical activity park of twenty to forty thousand square feet operates with a leadership team of three to five managers reporting to a general manager who in turn reports to the owner or ownership entity. Beneath the management team, shift leaders supervise floor staff during operating hours, with party hosts, attraction monitors, front desk attendants, food and beverage personnel, and maintenance technicians forming the bulk of the workforce. Total headcount typically ranges from thirty to seventy employees, with the majority working part-time hours that align with the park's weekend-heavy demand pattern.
The general manager is the single most consequential hire the owner will make. The role combines operational responsibility for daily revenue and guest experience, financial responsibility for labor and cost discipline, and people responsibility for hiring, training, and culture. The right general manager has either direct experience leading a similar venue or a demonstrated combination of hospitality leadership and operational rigor. Owners frequently underinvest in this role and pay for the mistake throughout the first eighteen months of operation. Compensation should be benchmarked against full-service restaurant general managers and similar entertainment operators in the local market.
Beneath the general manager, functional managers typically cover guest experience and front-of-house operations, attractions and safety, sales and parties, and food and beverage. In smaller parks these responsibilities collapse into two or three roles; in larger parks they expand to include a marketing manager and a maintenance manager. Shift leaders provide the operational bridge between management and floor staff during evenings and weekends, when the senior leadership team may not be present. Investing in shift leader development pays disproportionate dividends because these are the people actually running the park during peak hours.
Hiring Timeline and Recruitment
The hiring process for the leadership team should begin no later than four months before the planned opening date, with the general manager hired first and serving as a key voice in the recruitment of subsequent managers. Functional managers should be on payroll two to three months before opening, giving them time to participate in equipment installation, vendor relationships, and the development of operating procedures. Shift leaders typically join six to eight weeks before opening, and floor staff are hired in waves over the final four to six weeks, with enough time for full training and soft opening participation.
Recruitment channels for activity park staff are broader than many first-time operators expect. Online job boards reach the largest pool of candidates, but the highest-quality applicants for hospitality-oriented roles often come from referrals by existing staff, partnerships with local high schools and colleges, and relationships with cheerleading, gymnastics, and youth sports organizations whose participants are natural fits for an active environment. Referral bonuses, paid only after the new hire completes training and a probationary period, are a high-return investment that aligns the interests of existing staff with the success of recruitment.
Background checks should be standard for all employees and especially for any role with direct guest interaction. Activity parks serve children and families, and the duty of care extends to employee screening regardless of jurisdictional minimums. The cost of a background check is trivial compared to the consequences of a single incident, and parents notice when a park communicates clearly that all staff have been screened. Compliance with applicable employment laws, including age restrictions for minors operating specific attractions, requires explicit policy and documented training.
Job Profiles and Qualifications
Each role on the organizational chart deserves a written job profile that defines responsibilities, required qualifications, preferred qualifications, and reporting relationships. Floor staff who monitor attractions, often called court monitors or attraction attendants, need physical stamina, strong communication skills, and the temperament to enforce safety rules consistently with guests of all ages. Party hosts run birthday parties from arrival through farewell and require energy, organization, and the ability to manage groups of children and parents simultaneously. Front desk attendants set the first impression, handle waiver collection, and resolve the inevitable issues that arise during ticket purchase and check-in.
Food and beverage staff bring a different skill set, with food handler certification typically required by local health departments and prior experience in quick-service restaurants strongly preferred. Maintenance technicians span a range of skills from daily inspection and basic repair through more specialized work on attractions and building systems. Larger parks justify a dedicated technician on staff, while smaller parks often combine maintenance with shift leadership or use a part-time contractor relationship. Cross-training between roles, where labor laws permit, creates a more flexible workforce and gives ambitious team members a clearer path for advancement.
Training Programs
Training is the lever that converts capable individuals into a coherent team. The training program should cover three domains: safety and emergency response, customer service and hospitality, and role-specific operational procedures. Safety training is the highest priority and should be the first module any new hire completes. Topics include general park safety rules, attraction-specific operating procedures, height and weight restrictions, monitoring techniques, emergency protocols for evacuation and severe weather, and incident response. The training should combine classroom instruction with hands-on practice on the actual equipment, supervised by experienced personnel.
Customer service training builds the soft skills that distinguish memorable guest experiences from transactional ones. The curriculum should cover making eye contact, using guests' names, anticipating needs, handling complaints with empathy and ownership, and recovering from service failures. Role-playing exercises that simulate common scenarios, including unhappy guests, lost children, and medical emergencies, build the muscle memory that staff need when situations arise on the floor. Customer service is taught most effectively through example, which makes the behavior of the leadership team during training the single most powerful pedagogical tool available.
Role-specific training closes out the program and prepares staff for the specific responsibilities of their position. Court monitors learn the inspection routines and intervention techniques specific to their assigned attractions. Party hosts learn the script and choreography of birthday parties from arrival through farewell. Front desk attendants learn the point-of-sale system, waiver process, membership enrollment, and guest issue resolution. Each role should require demonstrated competence before the new hire works an unsupervised shift, with shadowing and supervised practice as the bridge between training and full responsibility.
Staff Certifications
Several formal certifications belong on the resumes of specific staff members. CPR and first aid certification should be required of all managers and shift leaders, with certified personnel scheduled to be on the floor during all operating hours. Many activity parks extend the certification requirement to all attraction monitors, recognizing that the first responder to a guest medical event is almost always the closest staff member rather than a manager called from the office. Certification courses are inexpensive and locally available through Red Cross chapters, fire departments, and private training companies.
Food handler certification is required for any staff working in food and beverage, with specific requirements varying by state and municipality. Some jurisdictions require a certified food protection manager on premises during all operating hours, with additional certifications for individual line staff. Trampoline park operations may require court monitor certification through industry programs such as those offered by the International Association of Trampoline Parks. Climbing wall and rope course operations often require facility-specific certifications administered by the equipment manufacturer or the Association for Challenge Course Technology. Tracking certification status and expiration dates is a back-office function that should be assigned to a specific manager.
Compensation and Retention
Compensation in the activity park industry varies meaningfully by market and by role, and operators must benchmark against local hospitality and entertainment competitors rather than relying on national averages. Floor staff and party hosts typically earn at or somewhat above the local minimum wage, with tips supplementing party host income in many parks. Shift leaders earn a meaningful premium for supervisory responsibility, and managers earn salaries comparable to restaurant or retail managers with similar revenue responsibility. General manager compensation should be competitive with full-service restaurant general managers, often including a bonus tied to financial and guest satisfaction metrics.
Beyond base compensation, retention is driven by culture, scheduling flexibility, and growth opportunity. The hospitality industry has notoriously high turnover, and activity parks compete with restaurants and retailers for the same labor pool. Operators who treat staff with genuine respect, publish schedules at least two weeks in advance, accommodate school commitments for younger staff, and create clear pathways from floor staff to shift leader to manager build the workforce stability that translates into consistent guest experience. Free or discounted park access for staff and their immediate families is a low-cost benefit with disproportionate impact on morale.
Staffing Ratios and Scheduling
Staffing ratios for activity parks balance safety, guest experience, and labor cost. Trampoline courts typically require one monitor for every fifteen to twenty active jumpers, with specific minimums regardless of attendance level. Climbing walls and rope courses often require one staff member per auto-belay station or per group. Soft play areas require monitors during operating hours even when attendance is low, and party rooms each need a dedicated host during scheduled events. Total labor as a percentage of revenue typically runs in the high twenties to low thirties for well-run parks, with discipline required to prevent overstaffing during slow periods and understaffing during peaks.
Scheduling is one of the most consequential management activities and benefits significantly from purpose-built software that integrates with the point-of-sale system, online booking platform, and payroll. Automated demand forecasting based on historical data and known events such as parties and school holidays produces meaningfully better schedules than manual approaches. Schedules should be published at least two weeks in advance and should accommodate shift swap requests through a transparent process that does not depend on the manager being available. Last-minute scheduling chaos is the single largest predictor of staff turnover at the floor level.
Soft Opening Strategies
The soft opening is the controlled bridge between construction and full commercial operation. The purpose is to stress-test every operational system, including the point-of-sale, the booking platform, the waiver process, the staff training, and the physical flow of guests through the space, while the consequences of failure are still recoverable. A typical soft opening sequence runs over two to three weeks and progresses from staff family days through invitation-only friends and family events through limited public previews before the formal grand opening.
Staff family events come first and serve dual purposes. The events give the team a chance to experience the park as guests, building genuine pride and personal investment, while creating controlled volume that lets management observe operational gaps without damaging the brand. Friends and family events follow, typically with discounted admission for invited guests of staff and investors. These events generate the first wave of authentic word-of-mouth marketing in the local community and produce honest feedback from people invested enough to point out problems but not involved enough to be defensive about them.
Limited public previews close out the soft opening sequence. Often promoted through email lists, membership pre-sales, and social media, these events open the park to the general public at reduced capacity and sometimes at reduced pricing. Reservations should be required to control volume, and operating hours can be shorter than the planned full schedule. Each soft opening event should be followed by a formal debrief in which management reviews what worked, what failed, and what adjustments will be made before the next event. The pattern of debriefs creates the operational muscle that the team will rely on for continuous improvement long after grand opening.
Grand Opening Planning
The grand opening is a marketing moment, not an operational milestone. By the time the doors open to the general public on grand opening day, every operational issue worth fixing should have been fixed during the soft opening. The grand opening event itself should be designed to maximize attention, drive trial, and produce the visual and social media content that fuels organic discovery in the weeks that follow. Local media coverage, ribbon-cutting ceremonies with civic officials, and partnerships with local influencers and family bloggers all deserve specific planning and follow-through.
Promotional pricing and special offers tied to grand opening can drive significant trial volume but should be structured to convert first-time visitors into repeat guests rather than to subsidize a single visit. Membership pre-sales and birthday party booking specials targeted at the grand opening window often produce the most durable revenue lift. Capacity management on grand opening day requires special attention; an under-capacity grand opening produces a dispiriting environment, while an over-capacity grand opening produces a chaotic one. Most operators err toward over-promoting and use timed entry, advance booking, and capacity caps to manage the resulting demand.
Pre-Opening Membership Sales
Membership pre-sales begin weeks or months before opening and produce both early revenue and a committed base of visit-driven customers from the first day of operation. The mechanics typically involve a discounted founder rate available only during the pre-opening period, with members locked into the rate for a defined period and granted priority access to the first soft opening events. Pre-sale revenue helps fund pre-opening expenses including marketing, staff training, and inventory, while the membership base creates a built-in audience for ongoing communication.
Marketing pre-sale memberships requires building an audience well before the membership offer is live. Email list capture should begin during the construction phase, with sign-ups offered through the website, social media, and any community engagement events. By the time the membership offer launches, the operator should have a list of at least several thousand local families who have expressed interest, providing a warm audience that converts at meaningfully higher rates than cold outreach. Founders' pricing and other early-bird benefits create urgency and reward the audience that has been engaged the longest.
Operating Procedures and Systems Readiness
Pre-opening readiness extends beyond people into the systems that will run the business every day. The point-of-sale platform, online booking engine, waiver management system, customer relationship management database, and any cashless payment or membership platform must all be installed, configured, integrated, and tested well before the first paying guest arrives. Each platform has its own configuration choices that affect reporting, taxation, refund handling, and integration with the others, and discovering misconfigurations during a busy Saturday is an expensive way to learn the lessons. Operators should plan for a full week of dedicated systems testing during the soft opening period, with intentional stress scenarios that simulate peak conditions.
Standard operating procedures, documented in written form and reinforced through training, cover the thousands of small decisions that staff make every day. Opening and closing checklists, cash handling procedures, daily safety inspections, cleaning schedules, party setup and breakdown protocols, incident reporting workflows, and emergency response procedures all deserve formal documentation. The documents do not need to be perfect on opening day; they need to be good enough to be useful, with a process for ongoing refinement as the team learns what actually works in practice. Treating the operating manual as a living document rather than a binder on a shelf is the difference between policies that shape behavior and policies that gather dust.
Summary Points
✓Activity parks are hospitality businesses with trampolines. staff performance defines the guest experience.
✓Build the organizational structure around a strong general manager hired no later than four months before opening.
✓Recruit through online boards, referrals, schools, and youth sports networks, with universal background checks.
✓Write detailed job profiles for every role and require demonstrated competence before unsupervised work.
✓Training spans safety, customer service, and role-specific procedures, with hands-on practice and role-playing.
✓Require CPR and first aid for managers and shift leaders. track all certifications with documented expiration management.
Part VII covers the daily disciplines that convert a beautifully built park into a consistently profitable one. It details the daily operating cadence, the safety and compliance systems that protect guests and the business, the food, party, and event programs that drive a large share of profit, and the performance measurement practices that keep management honest. Operational excellence is cumulative, built shift by shift through repeatable playbooks rather than heroic effort. These chapters give owners and general managers the toolkit to run the park at a high standard every hour it is open.
The Discipline Behind Operational Excellence
Operational excellence in an activity park is not an abstraction or a slogan printed on a break-room poster. It is the cumulative result of thousands of small decisions executed consistently by a team that understands why each decision matters. A park that opens its doors at ten in the morning has already been working for ninety minutes: the lights are tested, the mats have been walked, the registers have been counted, the music is playing, the bathrooms smell clean, and the first guest walks into an environment that feels intentional rather than accidental. Every detail guests notice, and every detail they do not, traces back to a protocol that someone followed that morning.
The operators who run the most profitable activity parks in North America treat daily operations as an engineered system rather than a list of chores. They recognize that a single missed step at open, such as a failed radio check or a restroom that was not restocked, can cascade into a guest complaint, a social media post, and a refund by mid-afternoon. The operational philosophy embraced by leading parks is built on the visible and consistent commitment of leadership to quality, on empowering staff to take ownership of safety protocols, and on encouraging guests to participate in maintaining the environment. These three pillars — leadership, ownership, and guest engagement — turn operations into a competitive advantage rather than a back-office function.
This chapter describes the daily operational rhythm of a well-run activity park, moving through the day as staff experience it. It covers the procedures that move the park from dark and empty to full and humming, the decisions that managers make as conditions change hour by hour, and the closing routines that set the next day up for success. The goal is not to prescribe a single correct way to run a park but to describe a proven framework that owners and general managers can adapt to their own venues, markets, and operating models.
Opening Procedures
The opening routine begins between sixty and ninety minutes before the first guest is scheduled to arrive and follows a documented sequence that every opener can execute without supervision. The duty manager arrives first, disarms the security system, walks the exterior of the building for overnight damage or safety concerns, and then conducts an interior sweep to confirm that no water leaks, pest activity, or mechanical issues developed overnight. Lights, HVAC, music, and attraction power are brought online in a specific order so that any electrical fault is isolated quickly rather than tripping a main breaker. The opening manager signs a master opening checklist that becomes part of the permanent operational record.
Once the facility is powered and inspected at the macro level, the opening team splits into functional zones: attractions, front desk, food and beverage, and facilities. Each zone has its own printed or digital checklist with time-stamped items, and each checklist culminates in a sign-off by the zone lead. Attractions openers inspect mats, padding, nets, foam pits, and safety signage according to the daily inspection protocol described in the next chapter. Front desk openers count the register, test the point-of-sale system, print the day's waiver and booking reports, and stage wristbands and grip socks. Food and beverage openers verify refrigeration temperatures, date-check inventory, and stage prep for the day's expected volume.
Fifteen minutes before the doors open, the duty manager conducts a pre-shift huddle with the entire team. The huddle covers three topics and never more: the day's staffing and assigned zones, any VIP bookings or large groups expected, and a single safety or service focus drawn from the previous day's incidents or guest feedback. Keeping the huddle to five minutes and three topics prevents it from degrading into a meeting that staff dread and start avoiding. A quick radio check confirms that every zone lead has a working device, and a final walk of the guest path confirms that the park is ready to receive its first family of the day.
Shift Management and Staff Scheduling
Effective shift management begins two weeks before the shift, not five minutes before. Activity parks are labor-intensive businesses in which wages typically represent the second-largest expense line after rent, and schedules built without forecasted attendance data will either overspend on slow days or leave the park dangerously understaffed on peak ones. The general manager should build schedules from a demand model that layers historical attendance, confirmed bookings, weather forecasts, school calendars, and local events. Modern scheduling platforms integrate with the point-of-sale system and surface a recommended staff count by hour, which the manager then adjusts with judgment.
Shift length and shift structure matter as much as total headcount. Most activity parks run two primary shifts with a short overlap in the middle of the day for shift change and restocking, plus a smaller closing crew. Openers tend to arrive between eight and nine in the morning, closers leave between ten and eleven at night, and a mid-shift of four to six hours covers the peak window. Part-time staff, which typically represent sixty to seventy-five percent of the workforce at a family entertainment venue, should be given their schedules at least two weeks in advance so that they can plan around school, second jobs, and family obligations. Predictable scheduling is one of the strongest drivers of retention, and retention is one of the strongest drivers of service quality.
Daily shift execution is managed by a duty manager whose only job during their shift is to run the floor. The duty manager does not stand behind the register, does not work the party room, and does not cover a court; they walk the building, respond to escalations, redeploy staff as attendance shifts, and enforce standards. When a duty manager gets pulled into a position, response times lengthen, small problems grow, and the experience degrades. Protecting the duty manager role from operational creep is one of the highest-leverage disciplines an owner can enforce.
Role Assignments and Rotation
Every hourly position in the park should have a written role description that specifies the primary duty, the physical location, the guests the position serves, and the standards by which performance is judged. Generic job titles like "attraction attendant" are not enough; the role card should read "Dodgeball Court Attendant," list the specific safety rules to enforce, the throughput target for the court, and the secondary duties during slow periods such as wiping down padding or restocking wristbands. Clear role cards reduce training time, improve accountability, and make it possible for a duty manager to redeploy staff quickly when the floor changes.
Rotation between positions serves two purposes: it reduces fatigue and repetitive-strain injury, and it builds a cross-trained workforce that can absorb callouts without collapsing. A typical rotation cycle places a staff member at a single attraction or station for forty-five minutes to an hour before moving them to a new post, with a short bathroom and water break built into every transition. Staff who spend an entire shift at the same high-stimulus court — the main trampoline floor, for example — lose acuity after the second hour and begin to miss safety violations. Rotation keeps eyes fresh and enforcement consistent.
Cross-training should be deliberate rather than accidental. Key staff in management, guest service, food service, and maintenance should be trained in at least one adjacent function so that the park can continue to operate during callouts or emergencies. A supervisor who can step behind the register, cover the café for an hour, or unjam a claw machine is vastly more valuable than a supervisor whose skills are narrow. Cross-training also creates a visible promotion path for ambitious hourly staff, and a visible path reduces turnover in a workforce that otherwise churns at industry rates of seventy to over one hundred percent per year.
Cleaning and Maintenance Protocols
A clean park is not a park that is cleaned at night; it is a park that is being cleaned continuously throughout the day. Guests form lasting judgments about a venue within the first sixty seconds of their visit, and those judgments are driven heavily by smell, visible dust, restroom condition, and the state of high-touch surfaces. The operational standard at leading parks is a dedicated floater whose only job during peak hours is to rotate through restrooms, party rooms, and high-touch zones on a timed loop, checking and cleaning at intervals of no more than thirty minutes. A paper log or digital checklist posted inside each restroom documents the cleaning cadence and provides accountability.
Cleaning tasks are divided into three tiers. Tier one covers continuous-shift cleaning and includes restroom checks, trash pulls in the main floor, wiping of party tables between bookings, and sanitization of frequently touched surfaces such as door handles, POS screens, and seating. Tier two covers daily deep-clean tasks performed during closing: mopping, full restroom reset, kitchen sanitization, and the cleaning of glass and mirrored surfaces. Tier three covers periodic tasks on a weekly, monthly, or quarterly cadence, such as laundering foam pit blocks, deep-cleaning trampoline mats, high-dusting the ceiling grid, and shampooing lobby carpets. Each tier should be documented, assigned, and verified.
Maintenance sits alongside cleaning and follows the same tiered logic. A computerized maintenance management system, or CMMS, is the platform of record for every attraction, piece of equipment, and facility component. Every work order, inspection, part swap, and vendor visit is logged in the CMMS, and every asset has an attached service history that travels with it for its entire life. Daily visual inspections by operators, weekly safety-mechanism checks, monthly comprehensive reviews, and annual third-party audits generate the data that feeds the CMMS. The system is not a paperwork exercise; it is the evidence base that protects the park during an insurance claim, a regulatory inquiry, or a liability lawsuit.
Incident Response and Documentation
Even the best-run activity park will experience incidents. Children fall, adults collide, guests trip, food is spilled, and occasionally a piece of equipment fails in a way that no inspection would have predicted. The question is not whether incidents will occur but whether the park is prepared to respond to them with speed, competence, and a documented process that protects the guest, the staff, and the business. The incident response protocol should be rehearsed, not merely written, and every new hire should walk through a simulated incident during their first week on the floor.
The response protocol follows a predictable sequence. The first staff member on the scene stabilizes the situation, clears other guests from the immediate area, and radios for a supervisor and for the designated first-aid responder. The supervisor assesses the severity, activates emergency services if needed, and assigns a staff member to stay with the guest while another begins collecting witness information. Every staff member carries a laminated card with the phone numbers for emergency services, the on-call general manager, and the park's insurance broker. Clarity of roles in the first ninety seconds of an incident is the single best predictor of how the incident is remembered by the guest and how it is resolved legally.
Documentation begins during the incident, not after it. The responding supervisor completes a written incident report within an hour of the event, capturing the time, location, description, names and contact information of involved parties and witnesses, actions taken, and whether emergency services were engaged. Video footage from the relevant cameras is preserved immediately; waiting until the next day risks losing the footage to the system's automatic overwrite cycle. Incidents involving serious injury, defined in most jurisdictions as any injury requiring an overnight hospital stay, are reported to the appropriate regulatory body within the timeframe specified by local law. Aggregated incident data is reviewed monthly by the management team to identify patterns and drive proactive improvements.
Customer Service Standards and Service Recovery
Customer service in an activity park is delivered in hundreds of brief interactions per day, each of which takes less than a minute and any of which can make or break a family's visit. Staff should be trained to a specific behavioral standard rather than a vague aspiration to friendliness. The standard at leading parks typically includes a verbal greeting within ten seconds of a guest's approach, use of the guest's name when it appears on a waiver or booking, eye contact, a smile, and a clear hand signal or gesture to direct the guest. These micro-behaviors are observable, coachable, and measurable through mystery shopping and video review.
Service recovery is the discipline of turning a disappointed guest into a repeat customer. When a guest complains, whether about a long wait, a dirty table, a rude interaction, or a product failure, the responding staff member follows a four-step protocol: listen without interrupting, acknowledge the guest's feelings, apologize without making excuses, and offer a specific remedy. Remedies are pre-authorized at defined levels so that hourly staff can resolve small issues without escalating, while larger issues are routed to the duty manager. A hundred-dollar comp authorized by a shift lead to save a birthday party is almost always a better investment than a thousand-dollar refund issued by a general manager three days later after a viral review.
Service recovery data should be tracked with the same rigor as incident data. Every comp, refund, and rebooking is logged with a reason code, and the aggregated report is reviewed weekly to identify systemic issues rather than treating each complaint as an isolated event. If thirty percent of complaints in a given month involve wait times at the café, the operations team knows where to invest labor or redesign the queue. Service recovery is not a cost of doing business; it is a diagnostic tool that reveals where the operation is weakest.
Peak Time Management
Peak periods — Saturday afternoons, holiday weeks, winter breaks, and rainy summer days — are when activity parks make most of their money and, simultaneously, when operational discipline is most tested. Capacity, throughput, and queue management become the dominant operational concerns. The park must have a documented peak operating plan that specifies additional staff positions to open, modifications to the attraction rotation, accelerated cleaning loops, and a dedicated queue manager at the front desk. The plan should be triggered automatically when bookings cross a defined threshold, removing the need for a judgment call in the middle of a busy morning.
Capacity must be actively managed rather than passively observed. Real-time monitoring technology, whether through ticketing system occupancy counts or RFID wristband data, allows management to see the current guest count by zone and compare it to the designed capacity. Timed-entry tickets, attraction-specific quotas, and session-based pricing distribute guests across the day rather than concentrating them in a two-hour peak. Attractions are engineered for throughput measured in guests per hour, and park-wide hourly throughput targets are one of the most important numbers a general manager tracks. When hourly throughput falls below target, something upstream has broken: usually staffing, usually at the front desk.
Queue design is as important as queue throughput. Queues are engineered to funnel guests efficiently, avoid pinch points, and provide visual and auditory cues about expected wait time. Digital signage at the entrance and at each attraction shows current wait times, upcoming session starts, and any safety notices, and keeps guests informed rather than frustrated. A team member stationed at each major queue during peak hours enforces line etiquette, helps families navigate their reservation, and converts waiting time into a positive touchpoint rather than dead time. Peak management is ultimately about information density: the more the guest knows about what is happening and when, the more patient they become.
POS Systems and Cash Handling
The point-of-sale system is the nervous system of the activity park. Every admission, every birthday deposit, every café order, and every retail sale flows through it, and every operational report — from hourly revenue to labor-cost-to-sales ratios — is built on its data. The POS must be configured with a disciplined item structure, consistent product codes, and integrations to the booking platform, the waiver platform, and the accounting system. A poorly configured POS produces reports that no one trusts, and untrusted reports lead managers to fly blind. The general manager should review the POS item tree quarterly and prune out obsolete SKUs.
Cash handling protocols protect both the business and the staff. Every register is opened with a counted bank documented on a cash control sheet signed by the cashier and a manager. Mid-shift cash pickups remove excess currency from the drawer and transfer it to a drop safe, limiting exposure in the event of a robbery and reducing the temptation for theft. Registers are counted at shift change, at close, and at any point when cash variance exceeds a predefined threshold. Variances are logged, investigated, and trended; a pattern of small variances at a single register is a stronger indicator of theft than a single large one.
Digital payments now represent the majority of transactions at most activity parks, but digital does not mean free of risk. Chargebacks, fraud, and payment-processor issues require their own protocols. Every refund requires manager approval and a reason code, every chargeback is contested with supporting documentation pulled from the booking and POS systems, and reconciliation between the POS batch and the bank deposit is performed daily. A once-a-month reconciliation is too late to catch a problem; the window to resolve most payment disputes is measured in weeks, not months.
Closing Procedures
Closing is not the reverse of opening, although it shares some of the same choreography. Closing is where tomorrow's success is built, because a park that closes sloppily opens sloppily the next morning. The closing manager issues last-call announcements at defined intervals before the final session, redirects guests toward exits, and begins the process of staging the facility for overnight. Attraction closers walk their courts one final time, collect lost items, and perform a simplified version of the morning inspection so that any damage caused during the day is logged before the team leaves.
Cash, sales, and labor are reconciled at close. Each register drawer is counted, variances are documented, and the day's deposit is prepared for bank drop or armored pickup. The duty manager reviews the day's sales report, labor report, and incident log, and writes a brief shift note that is shared with the incoming opening manager. The shift note is not a narrative; it is a short document that highlights what went well, what went wrong, any guest situations that may return the next day, and any maintenance items that were flagged. This handoff is the single most important piece of written communication in the daily operational cycle.
The final task of the closing team is to leave the building in a state that an opener will thank them for. Floors are mopped, trash is pulled, kitchen is sanitized, party rooms are reset for the next morning's bookings, and the alarm is armed. The closing manager signs the master closing checklist, performs a final walk, and locks the doors. A disciplined closing routine of forty-five to sixty minutes after the last guest leaves keeps labor costs under control, avoids the drift toward two-hour closes that erode profitability, and guarantees that the next day begins on solid ground.
Summary Points
✓Operational excellence is the cumulative result of disciplined daily execution, not a slogan, and it is built on visible leadership commitment, staff ownership.
✓Opening procedures follow a documented sequence that begins sixty to ninety minutes before the first guest arrives, splits into functional zones.
✓Schedules should be built from demand forecasts that blend historical attendance, bookings, weather, and school calendars.
✓A duty manager's only job during the shift is to run the floor. protecting the role from operational creep is one of the highest-leverage.
✓Written role cards, deliberate rotation, and systematic cross-training keep staff alert, reduce injury, and build a resilient workforce that can absorb callouts.
✓Cleaning runs on continuous, daily, and periodic tiers, and a dedicated floater during peak hours is the standard for maintaining guest-visible quality.
Safety as the Foundation of the Business
Safety is not a department in an activity park. It is the operating system on which every other function runs, and it is the condition that makes the business financially viable in the first place. A single preventable serious injury can close a park for weeks, trigger insurance premium increases that persist for years, and generate media coverage that no marketing budget can overcome. Conversely, a park with a documented safety culture and a clean incident record commands better insurance rates, attracts repeat customers, and earns the trust of school and corporate event buyers who carry their own liability concerns into every booking decision.
The regulatory environment for activity parks has evolved considerably over the past two decades. Industry bodies such as the International Association of Amusement Parks and Attractions, known as IAAPA, and standards organizations such as ASTM International through its F24 Committee on Amusement Rides and Devices, publish consensus-based safety standards that cover design, manufacture, testing, operation, maintenance, and inspection of attractions. The European Committee for Standardization has developed EN 13814, which is now recognized by over forty countries. A well-run park does not merely comply with the minimum legal standards in its jurisdiction; it adopts the relevant industry standards as internal benchmarks and monitors updates to those standards continuously.
This chapter describes the safety and compliance framework that a modern activity park should operate under. It moves from daily inspection routines to equipment maintenance schedules, from supervision ratios and waiver enforcement to liability management, incident investigation, insurance procedures, staff certification, and regulatory compliance. The framework is not designed to be copied verbatim; it is designed to be adapted by an owner or general manager to the specific attractions, jurisdiction, and risk profile of their venue, with the help of a qualified safety consultant and insurance broker.
Daily Safety Inspection Checklists
The daily safety inspection is the single most important operational ritual in an activity park. Every morning, before any guest is allowed access to any attraction, a trained inspector walks each court, climbs each platform, and checks each piece of equipment against a written checklist that has been validated by the manufacturer, the park's safety consultant, and, in many jurisdictions, the regulatory authority. The inspection is never rushed, never delegated to the least experienced staff member on the floor, and never skipped because the park is behind schedule. A skipped inspection is a future lawsuit.
For a trampoline park, the daily checklist covers every trampoline mat, every spring, every frame pad, every safety net, every foam pit, and every landing area. Mats are visually inspected for tears, burns, and excessive wear at connection points, and a tension check confirms consistent rebound across the court. Springs are counted, and a gap test identifies stretched or dead springs by looking for visible light between coils at rest. Frame pads are checked for secure attachment, and a hand press confirms that inner foam has not compressed and lost its impact-absorbing density. Safety nets are examined for fraying, tears, and stretched sections, and attachment points are confirmed as secure. Any component that fails inspection results in the immediate closure of the affected area until the repair is completed and verified by a supervisor.
Foam pits and landing areas require their own specialized inspection. Foam block depth and distribution are verified against the attraction's design specification, which is typically a minimum of four to six feet of foam depending on the activity above. Individual blocks are checked for compression damage, tears, and foreign objects, and the fluffing schedule is confirmed as current. A periodic full pit cleaning, in which all blocks are removed so that the underlying jump sheet can be sanitized and inspected, is logged at the frequency specified by the manufacturer and typically ranges from quarterly to annually. Every inspection item generates a pass, fail, or needs-attention entry that is time-stamped and tied to the inspector's identity in the digital checklist platform.
Equipment Inspection and Maintenance Schedules
Daily inspections catch problems as they emerge. Scheduled maintenance prevents problems from emerging at all. A tiered maintenance schedule, managed through a computerized maintenance management system, is the backbone of the park's equipment safety program. The tiers are designed to balance the cost of inspection against the consequences of failure, with the most frequent checks reserved for the components whose failure would most directly endanger a guest.
Daily inspections, performed by trained floor staff, consist of visual checks and minor maintenance on all rides and attractions before the park opens. Weekly inspections, performed by a senior operator or facilities lead, involve a more detailed examination of safety mechanisms, structural components, and high-wear parts. Monthly inspections, typically conducted by the facilities manager or a contracted technician, involve a comprehensive review of all safety aspects of each attraction, including torque checks on critical fasteners, weld integrity assessments, and detailed examination of items such as harness stitching and latch mechanisms. Annual audits, conducted by an independent third-party inspector qualified for the specific attraction type, close the loop and provide an unbiased assessment of the park's maintenance program.
The CMMS is the single source of truth for the entire maintenance program. Every asset has a unique identifier, a maintenance schedule, a service history, and a parts list. Work orders flow through the system from creation to completion, and completion is gated by a sign-off from the responsible technician. Parts inventory is managed within the CMMS so that critical spares, such as replacement springs, pad sections, and anchor hardware, are on hand when needed rather than ordered after a failure. During an insurance claim, a regulatory inspection, or a lawsuit, the CMMS export becomes the evidence base that demonstrates the park's due diligence. Without it, the park is relying on memory and paper, and both fail under cross-examination.
Staff Supervision Ratios
The most carefully inspected equipment in the world cannot compensate for inadequate supervision on the floor. Active supervision — staff members trained to watch for safety violations, intervene before collisions, and enforce court rules consistently — is the primary layer of safety during operating hours. Supervision ratios should be set by attraction type, informed by manufacturer guidance, industry standards, and insurer requirements, and enforced without exception regardless of attendance level. A park that reduces supervision because attendance is light on a Tuesday morning has mistaken low crowd density for low risk; a single enthusiastic jumper on an empty court can injure themselves as easily as on a full one.
Typical supervision ratios at a trampoline and activity park include one court monitor for every thirty-two jumpers on the main trampoline floor, dedicated attendants for each foam pit and landing area, one-to-one supervision at any specialty attraction such as a climbing wall with belays, and additional floor-roaming supervisors during peak periods. These ratios are a floor, not a ceiling, and they should be raised for children's sessions, for groups with a higher proportion of first-time jumpers, or when a specific attraction is running a promotional session that draws larger crowds. The supervision schedule is documented shift by shift, and coverage gaps caused by breaks and callouts are planned for explicitly rather than left to chance.
Supervisors are not passive observers; they are active coaches and rule enforcers. Training for a court monitor goes beyond the standard employee orientation and includes recognition of high-risk behaviors, verbal intervention techniques, de-escalation with non-compliant guests, and rapid incident response. Ongoing certification, typically delivered through programs such as the IAAPA-recognized safety training courses or manufacturer-specific curricula, is renewed annually. A court monitor who has not been recertified within the past twelve months is not assigned to a court, period. Supervision quality is audited through video review and mystery-guest programs, and performance feedback is delivered weekly rather than saved for an annual review.
Waiver Enforcement Procedures
Every guest who enters an activity park should sign a waiver before participating in any activity, without exception. The waiver is not merely a piece of paper or a box on a digital form; it is the documented acknowledgment that the guest understands the inherent risks of the activities, has reviewed the rules, and accepts responsibility for compliance. In most North American jurisdictions, a properly constructed and properly executed waiver is a significant shield against liability, although the specific legal weight varies by state and province and should be reviewed annually with the park's attorney.
Waiver enforcement begins at the front desk and is woven into the guest arrival flow. Digital waiver platforms have largely replaced paper because they produce searchable records, link waivers to bookings and to individual guests through ID verification or email confirmation, and retain records for the statute of limitations in the relevant jurisdiction. A guest without a signed waiver is not given a wristband, and a guest without a wristband is not allowed onto any attraction. This rule is absolute and is enforced by front desk staff, by court monitors at the attraction entry point, and by supervisors on patrol. Ambiguity here creates liability, and liability compounds.
Children present a distinct waiver challenge because only a legal guardian can sign on behalf of a minor. The guardian must be physically present at the time the waiver is signed, and their identification should be captured digitally along with the waiver. Groups of children arriving with a non-guardian adult — a coach, a neighbor, a distant relative — cannot be admitted unless the guardian has signed the waiver in advance through the digital platform. School groups and summer camps bring their own complexities, and the standard operating procedure should require that the organizing entity collect signed waivers from each child's guardian and transmit them to the park at least forty-eight hours before the visit. Front desk staff should be trained to decline admission politely but firmly when waiver documentation is incomplete.
Liability Management and Risk Mitigation
Liability management begins long before an incident occurs, and it is built from many small components rather than a single master stroke. The park's legal structure, typically a limited liability company or corporation, isolates personal assets from business liability. The park's insurance program, anchored by general liability coverage in the range of one to five million dollars per occurrence with an umbrella layer on top, covers the residual risk that risk mitigation cannot prevent. The park's contracts with vendors, manufacturers, and landlords include indemnification clauses that allocate risk appropriately. The park's waivers, as discussed above, create an additional layer of defense. Each component is reviewed annually with counsel and with the insurance broker.
Operational risk mitigation focuses on the behaviors and conditions that generate the highest proportion of incidents. Industry data consistently show that a small number of high-risk behaviors — double bouncing, adults jumping with small children, performing flips or inverted maneuvers on surfaces not designed for them, and ignoring posted court rules — account for a disproportionate share of injuries. The park's operating rules should target these behaviors specifically, signage should be consistent across the facility, and court monitors should be trained to intervene the first time a behavior is observed rather than waiting for a pattern. A first-time verbal warning, a second-time removal from the court, and a final escalation to a supervisor is a simple enforcement ladder that staff can execute without hesitation.
Physical risk mitigation includes the design and layout of the facility itself. Clear sight lines from supervisor positions to every area of every court, non-slip surfaces in transition areas, defined entry and exit points, and the elimination of crush zones where guests can collide unexpectedly are all design decisions that reduce the frequency and severity of incidents. For existing parks, a periodic site audit by a qualified safety consultant identifies changes in guest flow, signage visibility, or lighting that have emerged over time and need to be addressed. Risk mitigation is a living process, not a one-time design exercise.
Incident Investigation and Reporting
When an incident occurs, the response protocol described in the previous chapter takes precedence. Once the guest has been cared for and the immediate scene has been secured, the investigation phase begins. A formal investigation is required for any incident that involves an injury, any near-miss that could have caused an injury, and any equipment failure, regardless of whether a guest was involved. The goal of the investigation is not to assign blame but to identify the root cause — mechanical, operational, or behavioral — and implement corrective actions that prevent recurrence.
The investigation is conducted by a designated safety lead, typically the general manager or the facilities manager, working from a standardized investigation template. Inputs include the incident report filed by the responding supervisor, statements from witnesses and staff, photographs of the scene and the equipment, video footage from relevant cameras, maintenance records for the affected equipment, and the waiver and booking record for the guest involved. The investigation should be completed within seventy-two hours of the incident, because memories fade, video is overwritten, and staff turn over. Delayed investigations produce thin reports, and thin reports create legal exposure.
Reporting obligations are defined by the regulatory authority in each jurisdiction. In most North American markets, incidents that result in an injury requiring an overnight hospital stay are reportable to the state or provincial authority within a specified window, which can range from twenty-four hours to five business days. The park's general manager should maintain a current reference document that specifies the reporting requirements, the authority's contact information, and the reporting format. Non-reporting or late reporting of a serious incident is itself a regulatory violation and can compound the original liability. Aggregated investigation findings are reviewed quarterly by the management team and inform updates to training, signage, and operating procedures.
Insurance Claim Procedures
An incident that may generate an insurance claim is handled differently from the moment it is recognized as such. The general manager should notify the insurance broker as soon as the incident is stabilized and the guest has been assessed, even when it is not yet clear whether a claim will be filed. Early notification protects the park's coverage, gives the broker time to assemble defense counsel if needed, and often accelerates the resolution of the claim. Waiting to notify the broker until a demand letter arrives, sometimes months later, can compromise coverage under the policy's notice provisions.
Documentation is the single most important input to the insurance process. The incident report, investigation file, video footage, waiver, booking record, maintenance history for the affected equipment, and training records for the involved staff are all preserved in a dedicated incident file that is not modified after the fact. Any communication with the guest about the incident — phone calls, emails, text messages — is documented in the file. Staff are coached to express sympathy without admitting fault, because expressions of fault in the immediate aftermath of an incident can undermine the park's defense later.
The insurance claim itself is managed by the broker and the insurer's claims adjuster, with the general manager serving as the park's internal point of contact. The general manager should not communicate directly with the guest's attorney or with any investigator from an opposing party; all such communication is routed through the broker. Claims can take months or years to resolve, and the park's cooperation with the insurer — prompt document production, availability for depositions, and consistent testimony — is a condition of coverage. A park with disciplined documentation and a clean compliance record typically sees claims resolved at or below the adjuster's initial reserve, while a park with sloppy records sees claims balloon through the process.
Ongoing Training and Certification Renewal
Staff training is not a one-time onboarding event. It is a continuous program that begins with new-hire orientation, progresses through position-specific certification, and continues throughout the employee's tenure with regular refreshers and renewals. The training curriculum should be documented, the attendance records should be retained, and the certification status of every staff member should be visible to the scheduling manager so that no staff member is placed in a role for which they are not currently certified.
New-hire training at a well-run activity park typically consumes between eight and twenty hours over the first week of employment, depending on the role. The curriculum includes general orientation to the park's policies and values, safety fundamentals, position-specific procedures, emergency response protocols, and a supervised floor shadow before the new hire is scheduled solo. Certifications for specific roles — court monitor, belay operator, first-aid responder, food handler — are earned through formal coursework and skills demonstrations, documented in the employee's training file, and renewed at intervals specified by the issuing body or by the park's insurer.
Refresher training should be built into the operating calendar rather than left to discretion. A monthly all-hands safety meeting, a quarterly skills drill for court monitors, an annual emergency evacuation simulation involving the local fire department, and ad hoc sessions triggered by incidents or near-misses keep skills sharp and reinforce the safety-first culture. Training sessions are documented with a sign-in sheet, a curriculum outline, and a brief assessment. When a regulator or an insurer asks the general manager to demonstrate the park's training program, the answer should be a binder or a digital folder that is already assembled, not a scramble to reconstruct attendance records after the fact.
OSHA Compliance and Health Standards
Occupational safety for staff is a legal obligation distinct from guest safety, and in the United States it is regulated primarily by the Occupational Safety and Health Administration, known as OSHA. The park's OSHA compliance program includes a written safety manual, posted required notices, documented training on relevant hazards such as bloodborne pathogens and chemical handling, a log of work-related injuries and illnesses maintained on OSHA Form 300, and a process for reporting serious employee injuries to OSHA within the required windows. Comparable regulatory regimes exist in Canada, the United Kingdom, and other markets, and the park's general manager should maintain current knowledge of the applicable framework.
Health standards extend beyond OSHA to the local public health authority, which typically has jurisdiction over food service, restroom facilities, drinking water, and the general cleanliness of public accommodations. The park's food operation, covered in detail in the next chapter, must hold the appropriate food service permit and must pass periodic inspections. Restrooms must meet fixture-count requirements based on occupancy, must be kept in sanitary condition, and must be accessible to guests with disabilities as required by the Americans with Disabilities Act or the equivalent in the relevant jurisdiction. A surprise inspection by the health authority is a regular occurrence, and the park should be continuously ready for one.
Bloodborne pathogen exposure is a specific hazard in any venue where minor injuries are common. The park should maintain bloodborne pathogen spill kits at defined locations, train all staff in the exposure control plan, and document every exposure incident. Hand sanitizing stations placed strategically in high-traffic areas reduce the transmission of general illness, and a dedicated cleaning team continuously disinfects high-touch surfaces such as ride harnesses, tables, and door handles. During a public health event such as a seasonal influenza outbreak or a broader pandemic, the park's protocols can be tightened rapidly by activating a pre-written enhanced-operations plan rather than improvising under pressure.
Summary Points
✓Safety is the operating system of the business, and a documented safety culture improves insurance rates, drives repeat visitation.
✓Daily safety inspections follow a validated, written checklist, are never skipped.
✓Equipment maintenance is tiered into daily, weekly, monthly, and annual inspections.
✓Supervision ratios are set by attraction type, enforced regardless of attendance, and backed by annual certification renewal for court monitors and attendants.
✓Digital waivers are linked to bookings and wristbands, and no guest without a signed waiver is admitted to any attraction.
✓Liability management is a layered system combining legal structure, insurance coverage, contracts, waivers, operational rules, and physical design.
Why Ancillary Revenue Decides Profitability
Admission revenue pays the rent at an activity park. Ancillary revenue pays the owner. The distinction is critical because the economics of the activity park business model rely on secondary spending to convert a break-even attendance business into a profitable one. Food and beverage, birthday parties, group events, and retail collectively generate between thirty and fifty-five percent of total revenue at a well-run venue, and they carry higher gross margins than admissions because their cost structures are more variable and their pricing is less exposed to competitor benchmarking. A park that optimizes admissions while neglecting ancillaries leaves the majority of its available profit on the table.
The strategic insight for the owner or investor is that ancillary revenue is not a side business; it is a core business embedded within the core business. It requires its own operational systems, its own staffing plans, its own inventory controls, and its own performance metrics. The same general manager who obsesses over throughput on the trampoline floor must obsess equally over food attach rate, birthday party upsell conversion, and group event booking lead times. Treating food as an afterthought, or treating birthdays as a nuisance imposed by the public, is the fastest route to mediocre financial performance.
This chapter describes the operational systems that drive ancillary revenue. It covers food service operations and regulatory compliance, the execution of birthday parties as a repeatable production system, pricing and upselling strategy for party packages, group event management for schools, camps, and corporate clients, the economics of capacity utilization, retail and inventory management, and the revenue-per-party benchmarks that allow an owner to compare their performance against the industry. Each topic is approached from the perspective of a general manager responsible for execution and an owner responsible for financial outcomes.
Food Service Operations and Compliance
Food service at an activity park ranges from a simple café serving pre-packaged snacks and heat-and-serve pizzas to a full-service restaurant with a licensed kitchen and a variable menu. The appropriate format depends on the park's size, local competition, liquor licensing feasibility, and the owner's appetite for operational complexity. Regardless of format, the food operation is subject to the full weight of public health regulation, and the systems required to operate it safely are non-negotiable. The food operation is also the single most common source of health-department violations at activity parks, which makes disciplined execution a both a legal and reputational imperative.
Staff certification is the foundation. All food service managers and supervisors must hold a valid ServSafe Food Manager certification or the equivalent recognized in their jurisdiction. All other employees who handle food, including cooks and servers, must hold a ServSafe Food Handler certification. Staff who serve alcohol must complete responsible beverage service training such as TIPS or the state-mandated equivalent, and staff trained in allergen awareness should be identified on every shift to handle allergen inquiries and special orders. Certification records are retained in the employee file and cross-referenced to the scheduling system so that no uncertified staff member is placed in a food-handling role.
Temperature control is the single most important food safety discipline. Hot time-and-temperature control for safety foods, known as TCS foods, must be held at or above 135°F, and cold TCS foods must be held at or below 41°F. Food temperatures are checked with a calibrated thermometer at least every two hours and logged in a temperature log that is retained for the period specified by the local health code. Holding without temperature control is allowed only with prior written procedures and regulatory approval, and in that case cold food can be held for up to six hours if it starts at 41°F or lower and does not exceed 70°F, while hot food can be held for up to four hours if it starts at 135°F or higher. All such food is labeled with a discard time and discarded when that time is reached. Self-service areas are protected by sneeze guards, food items are labeled, each item has its own serving utensil, and staff monitor these areas continuously to enforce safe guest practices.
Facility and equipment standards extend the compliance framework into the physical design of the kitchen. Floors, walls, and ceilings in food prep areas are smooth, durable, and easy to clean, with coving at the floor-to-wall junction to aid cleaning and exclude pests. All food-contact equipment is certified by NSF or another ANSI-accredited body. Stationary equipment is installed on legs at least six inches off the floor or sealed to a masonry base to allow for cleaning underneath. Water is drawn from a potable source, plumbing is installed to prevent backflow with air gaps at appropriate fixtures, lighting is shatter-resistant or protected, ventilation is sufficient to remove heat and smoke and is cleaned on a documented schedule, and garbage is handled in leak-proof covered cans with outdoor dumpsters on a smooth, non-absorbent surface with tight-fitting lids. Pest control is managed through a three-layered program: deny access by sealing cracks and covering drains, deny food and shelter through extreme cleanliness and garbage management, and contract with a licensed pest control operator for regular monitoring and treatment.
Birthday Party Execution Systems
Birthday parties are the workhorse revenue stream of the activity park industry. A single Saturday at a mid-sized trampoline park can host twelve to twenty parties, each generating between four hundred and fifteen hundred dollars in revenue, with most of that revenue concentrated in a four-hour afternoon window. The operational challenge is that birthdays must be executed with the consistency of a production line while delivering the emotional impact of a custom event. Parents who book a birthday party are not buying admission; they are buying a memory, and the delivery of that memory cannot be left to chance.
Party execution begins with a standardized production system. Every party follows a written timeline that specifies the exact sequence of events in five-minute increments: guest arrival, waiver check, wristband distribution, host introduction, open play on the attractions, transition to the party room, food service, cake and gifts, and exit. The party host, a dedicated staff member assigned to the booking for its full duration, follows a laminated run sheet and is not pulled to cover other floor positions. The party room is staged before the guests arrive with table settings, decorations included in the package, gift table, and any personalized items such as a printed happy birthday banner. Execution consistency across hundreds of parties per year is the operational proof that the park can scale.
The party host role is the linchpin of the system. A skilled host takes ownership of the family's experience from the moment they arrive, learns the birthday child's name and uses it throughout, manages the timing so that the family never feels rushed or abandoned, coordinates with the kitchen so that food arrives when the family is seated, and handles small problems — a cranky toddler, a late arrival, a dietary restriction discovered at the table — without involving the duty manager. Hosts are specifically recruited for warmth and energy, are trained beyond the standard staff curriculum, and are paid a premium that typically includes a tip share from the party package. Turnover among party hosts is expensive because each new host requires twenty-plus hours of training to reach competence, so retention is an operational priority.
Post-party execution closes the loop. The family leaves with leftover food packed, gifts gathered, and a small parting gift for the birthday child if the package includes one. Within forty-eight hours, a thank-you email is sent that includes photos if the park offers a photo service, a review request, and a discount code for the birthday child's next visit. The booking record is closed in the system with notes on anything unusual, and the party host writes a brief debrief on what went well and what did not. Aggregated debrief data drives continuous improvement to the production system. Parks that treat each party as a one-off event instead of a repeatable production lose the compounding benefit of systematic learning.
Party Package Pricing and Upselling
Party packages should be designed as a menu of tiers rather than a single option. A typical structure offers three tiers — standard, premium, and ultimate — priced at escalating per-child rates with escalating inclusions. The standard package includes admission, the party room for a fixed time block, pizza, drinks, and the host; the premium package adds decorations, upgraded food options, a longer room block, and a parting gift; the ultimate package adds reserved attraction time, a dedicated area, additional decor, a photographer or photo package, and personalized touches. Per-child pricing typically ranges from around twenty to over fifty dollars depending on the tier, the market, and the package inclusions, with minimum party sizes of eight to ten children to protect room utilization economics.
Upselling is not an afterthought; it is engineered into the booking flow. At the time of the initial online booking, the customer is presented with a default package and a clear visual comparison of the tiers, with the premium tier designed as the anchor. During the follow-up confirmation call or email, the booking coordinator offers specific add-ons: additional food items such as wings, salads, or dessert upgrades; beverage upgrades such as soda pitchers or specialty drinks; decor upgrades such as themed table settings; and experiential add-ons such as a private session on a specialty attraction or a visit from a costumed character. A scripted conversation with a menu of add-ons converts into revenue far more reliably than a hope that the customer will ask.
The measurable output of the upselling program is average revenue per party, which should be tracked weekly and benchmarked against a target. A useful target for a mid-market venue is a thirty to forty-five percent lift in average revenue per party over the base package price. If actual performance falls short, the booking coordinator's script is reviewed, the add-on menu is tested for price sensitivity, and seasonal promotions are introduced to drive specific upsells. Upselling is not about pressuring customers; it is about presenting value-adds in a structured way so that customers who want them can find them and pay for them. The absence of structure is a silent revenue leak.
Group Event Management for Schools, Camps, and Corporate Clients
Group events — school field trips, summer camp outings, corporate team-building days, youth sports team celebrations, and fundraising events — represent a second ancillary revenue stream with economics distinct from birthday parties. Groups typically book during off-peak hours, which improves asset utilization without cannibalizing peak-period family revenue, and they book in volumes that can fill otherwise empty weekday mornings and afternoons. A park that develops a systematic group sales program can add ten to twenty percent to annual revenue without adding a single hour of peak operating time.
Group sales require a dedicated operational approach. A group sales coordinator, either a full-time hire or a defined responsibility of the general manager in smaller parks, owns the inbound inquiries, the outbound prospecting, and the relationship with repeat group buyers. Lead generation for schools involves direct outreach to local school district activity coordinators, PTO and PTA presidents, and physical education departments, with pricing structured around per-student rates that accommodate tight school budgets. Camp outreach targets summer camps, church groups, and after-school programs, often during the off-season when camp directors are finalizing summer schedules. Corporate outreach targets HR and office managers, with messaging built around team building, holiday parties, and end-of-quarter celebrations. A customer relationship management tool tracks inquiries, quotes, bookings, and repeat activity.
Group booking operations are distinct from party operations. Waiver collection for minors is handled in advance through the organizing entity, which distributes digital waiver links to parents and collects them at least forty-eight hours before the visit. Payment is typically collected as a deposit at booking with the balance due on arrival, and invoicing for corporate bookings may extend to net-thirty terms with proper contracting. On-site execution is handled by a dedicated group coordinator or senior host who manages the check-in, assigns wristbands in bulk, briefs any accompanying teachers or chaperones on supervision expectations, and coordinates with the kitchen for any included food service. Groups that run well become annual repeat customers, which is the single most valuable outcome of the group sales program.
Event Profitability and Capacity Utilization
The profitability of an event — whether a birthday party, a group booking, or a private buyout — depends on three variables: the price paid, the marginal cost of delivery, and the opportunity cost of the capacity consumed. A birthday party at three hundred dollars looks profitable in isolation, but if it blocks a party room that could otherwise have hosted a six-hundred-dollar package during the same time slot, the true economic outcome is a three-hundred-dollar loss of opportunity. Capacity utilization analysis brings this truth to the surface and drives pricing discipline.
Capacity utilization is measured as the percentage of available event slots that are booked and the percentage of each slot's revenue potential that is captured. A park with ten party rooms and six available Saturday time slots per room has sixty room-slots per Saturday, and its utilization rate is the booked rooms divided by sixty. Revenue utilization is the actual revenue divided by the maximum revenue if every slot were booked at the highest-tier package. Tracking both metrics weekly surfaces patterns: slots that consistently go unbooked may be priced too high or scheduled at inconvenient times, while slots that always sell out may be priced too low.
Dynamic pricing addresses utilization patterns systematically. Peak Saturday afternoons and school-break afternoons are priced at a premium. Weekday afternoons and early-morning slots are priced at a discount. Last-minute bookings for slots that would otherwise go unfilled can be discounted through targeted email to recent customers. The practice of dynamic pricing is standard in the hotel and airline industries and is increasingly standard in activity parks, enabled by booking software that adjusts prices automatically based on demand signals. Owners who resist dynamic pricing because they fear customer confusion are leaving measurable money on the table; owners who implement it with clear communication see material improvements in both revenue and utilization.
Retail Operations and Inventory Management
Retail is the smallest but highest-margin of the ancillary revenue streams. A well-curated retail assortment of grip socks required for trampoline jumping, branded apparel, small toys, and souvenir items can contribute five to ten percent of total revenue at gross margins of sixty percent or higher. Grip socks alone, because they are typically required for admission and priced at three to five dollars, convert at close to one hundred percent of first-time guests and generate consistent revenue without active selling effort. The operational discipline is to treat the retail operation as a retail operation rather than an afterthought at the front desk.
Inventory management for retail follows standard retail disciplines adapted to the scale of the park. Stock-keeping units are assigned to every item and tracked in the point-of-sale system. Physical inventory counts are performed monthly, with cycle counts of high-value items performed weekly. Reorder points are set to maintain minimum stock levels without overcommitting cash to slow-moving inventory. Slow-moving items are identified through sales velocity reports and either repriced, relocated, or discontinued. A retail buyer, typically the general manager or a designated assistant, reviews the assortment quarterly and introduces new items aligned with seasonal themes, popular culture, or guest feedback.
Visual merchandising at the front desk and in dedicated retail zones drives the impulse purchase behavior that powers the category. Items are displayed at children's eye level when the target buyer is a child, at adult eye level for adult merchandise, and near the register for high-margin impulse items. Branded apparel creates a walking advertisement for the park and should be priced accessibly enough to drive volume, typically in the fifteen to thirty-dollar range for t-shirts and hoodies. The retail operation is staffed by the front desk team as part of their normal duties, which keeps labor cost attribution clean and prevents retail from becoming a cost center in its own right.
Revenue per Party Benchmarks
Benchmarking revenue performance against the industry is essential for understanding whether the park is optimizing or leaving money behind. Several useful benchmarks apply to birthday parties and group events. Average revenue per party, inclusive of package, food upsells, and retail attach, typically falls between four hundred and seven hundred dollars at mid-market venues and can exceed a thousand dollars at premium positioned venues. Average revenue per guest at a party, which is the total party revenue divided by the number of attendees, is a useful cross-check and typically ranges from thirty to sixty dollars.
Food attach rate measures the percentage of parties that purchase food beyond the package inclusion, and the average incremental food spend per party. Upsell conversion measures the percentage of bookings that purchase at least one add-on beyond the base package. Retail attach measures the percentage of party attendees who make a retail purchase and the average spend per attendee. Each of these metrics has a target, and performance against target is reviewed weekly by the general manager. When a metric falls behind, a specific operational response is activated rather than leaving the gap to resolve itself.
The compound effect of improving each ancillary metric is significant. A park hosting fifteen parties per day, averaging five hundred dollars per party, generates seventy-five hundred dollars of party revenue daily. A fifteen percent lift in average party revenue, achieved through systematic upselling and attach-rate improvement, generates an additional eleven hundred dollars per day or roughly four hundred thousand dollars per year at the same attendance level. The operational work that produces this lift — better script, better tiered menu, better host training, better data — costs a small fraction of the incremental revenue it generates. Ancillary revenue optimization is one of the most attractive returns on management effort available anywhere in the business.
Summary Points
✓Ancillary revenue from food, parties, group events, and retail drives the majority of profit in an activity park and must be managed as a.
✓Food service operations require ServSafe-certified staff, strict temperature control with logged checks every two hours.
✓Birthday parties follow a standardized production system with written timelines, dedicated hosts, staged party rooms, and post-party follow-up that drives repeat bookings.
✓Party packages are structured in tiered menus, with upselling engineered into the booking flow through scripted conversations and a menu of add-ons that lift.
✓Group events from schools, camps, and corporate clients fill off-peak capacity and require a dedicated sales coordinator, CRM tracking, advance waiver collection.
✓Event profitability depends on capacity utilization. dynamic pricing across peak and off-peak slots materially improves both revenue and utilization.
From Intuition to Data-Driven Management
Activity parks have historically been managed by intuition. An experienced operator could walk the floor, glance at the parking lot, listen to the sound of the café, and form an accurate sense of how the business was performing that day. That intuition remains valuable, but it no longer suffices. The best-managed parks now run on a data infrastructure that makes yesterday's performance visible at a glance, identifies emerging trends before they become problems, and allows owners and general managers to test operational changes and measure their effects. The shift from intuition to data is the single largest operational advancement in the industry over the past decade, and it is accessible to any park willing to invest modestly in the right systems.
The case for data-driven management is economic, not philosophical. An owner who cannot tell whether the recent discount promotion drove incremental visits or simply cannibalized full-price bookings cannot make rational marketing decisions. A general manager who does not know the conversion rate of walk-in inquiries to bookings cannot improve it. A board or an investor who sees monthly revenue without a view of underlying unit economics cannot distinguish a healthy park from one quietly eroding. Data is not a reporting exercise; it is the input to every important operational decision, and the quality of those decisions is directly tied to the quality of the data.
This chapter describes the performance measurement framework that a modern activity park should operate under. It covers the key performance indicators that deserve attention, the structure of the financial and operational dashboards that surface those indicators, the collection and use of customer feedback, the analysis of attendance and conversion metrics, and the practice of benchmarking against industry peers. The framework is not exhaustive; no framework is. It is a starting point that the general manager and owner can adapt to the specific attractions, market position, and strategic priorities of their park.
Key Performance Indicators
Key performance indicators, known as KPIs, are the small number of metrics that most directly capture the health of the business. The temptation when setting up a KPI program is to track everything, which produces dashboards that no one reads and numbers that drive no action. The discipline is to identify the ten to fifteen metrics that matter most and to track those with consistency and rigor. Additional metrics are available on demand when specific questions arise, but the core dashboard stays small.
Financial KPIs form the first tier. Average spend per guest measures the total revenue contribution of each visitor and is calculated as total revenue divided by attendance. Profit percentage, calculated as net income divided by revenue, tracks overall profitability after all costs and is typically reviewed monthly. Ancillary spending as a percentage of total revenue monitors the health of the food, party, event, and retail operations. Labor as a percentage of revenue tracks the single largest controllable cost and should be compared against a target that varies by month to reflect seasonality. Cost of goods sold as a percentage of food revenue tracks the efficiency of the food operation.
Customer KPIs form the second tier. Revisitation rate, which measures how often waiver holders return within a year, is a leading indicator of loyalty and offering quality; a rate above two times per year is a sign of a healthy park. Customer satisfaction scores gathered through surveys and online reviews capture the subjective experience. Net Promoter Score, discussed in detail below, captures likelihood to recommend. Loyalty program participation rate measures the effectiveness of membership and rewards schemes. Operational KPIs form the third tier. Attendance is the headline number. Occupancy rate compares actual visitor counts against designed capacity. Equipment utilization measures attraction-level usage. Downtime measures the percentage of operating hours that individual attractions were non-operational for maintenance. Each KPI has a target, a current value, a trend, and an owner accountable for improving it.
Financial Reporting Dashboards
The financial reporting dashboard is the nerve center of the general manager's morning. At a well-run park, the general manager opens the dashboard before any guest arrives, reviews the previous day's performance across the core KPIs, identifies any red flags, and adjusts the day's plan accordingly. The dashboard is not a static monthly report produced by the accountant; it is a live or near-live view built on data flowing continuously from the point-of-sale system, the booking platform, the scheduling system, and the accounting system.
The structure of the dashboard follows a hierarchy from high-level to detailed. The top row shows the headline metrics for the previous day, week, month, and year to date: revenue, attendance, labor percentage, and profit percentage, each compared against budget and against the same period last year. The second row breaks down revenue by line of business: admissions, food and beverage, parties, groups, retail, and other. The third row shows ancillary attach rates, average spend per guest, and upsell conversion. A fourth row highlights any metric that has fallen outside its acceptable range with a visual flag, so that the general manager cannot miss a problem simply because the dashboard is long.
The dashboard is complemented by a weekly and monthly operational review that gathers the management team for thirty to sixty minutes. The weekly review looks at the previous seven days, identifies the two or three metrics that require attention, and assigns a specific action to a specific person with a specific deadline. The monthly review steps back to assess trends, compare actual performance against budget, and reassess priorities for the coming month. Discipline in these reviews is what prevents the dashboard from becoming wallpaper. Owners should expect their general manager to run these reviews on a predictable cadence and should occasionally sit in to signal that the data matters.
Customer Feedback Collection
Customer feedback is the qualitative complement to the financial and operational numbers. Numbers tell the general manager what happened; feedback tells them why. A rigorous feedback program blends multiple channels, structured and unstructured, active and passive, and aggregates the inputs into a view that drives specific operational improvements.
The primary active channel is the Net Promoter Score survey, delivered by email twenty-four to seventy-two hours after the visit. The single question — how likely are you to recommend us to a friend or colleague, on a scale of zero to ten — produces a score that can be benchmarked against other entertainment venues and against the park's own history. Respondents who score nine or ten are promoters, scores of seven or eight are passives, and scores of zero through six are detractors. The Net Promoter Score is calculated as the percentage of promoters minus the percentage of detractors, and it is tracked weekly. An open-text follow-up question captures the reasons behind the score, and the qualitative themes are coded and tallied to reveal which operational issues drive detractor responses.
Passive channels include public review sites such as Google, Yelp, Facebook, and TripAdvisor, and these should be monitored daily by a designated responder. Every review receives a response within twenty-four hours, with detractors receiving a personal outreach that attempts service recovery and promoters receiving a thank-you. Response rate and response time are themselves metrics tracked in the customer feedback dashboard, because the business consequence of unresponded detractor reviews is measurable: a public review with no response from the business converts more prospective customers into non-customers than the same review with a thoughtful, specific response. Feedback data should be reviewed weekly and the themes should flow into the operational improvement pipeline alongside incident data and financial anomalies.
Operational Metrics
Operational metrics capture the execution quality of the park beyond the financials and the customer sentiment. They are the internal measures that tell the general manager whether the operation is running the way it is designed to run. When operational metrics drift, financial and customer metrics eventually follow, which is why operational metrics are leading indicators and are often more valuable than lagging financial results.
Incident metrics are foundational. Total incidents per ten thousand guests, split by severity, provides a normalized view that controls for attendance fluctuation. Incidents are further segmented by attraction, by time of day, by day of week, and by guest age group to identify patterns. A spike in incidents on a specific attraction triggers a review of supervision levels, equipment inspection records, and guest communication. A pattern concentrated in a specific time block points to staffing or training gaps. Incident metrics should be reviewed weekly at the management meeting and monthly at the owner level.
Cleanliness and facility metrics are measured through a combination of scheduled audits and guest feedback. A weekly cleanliness audit, conducted by a supervisor using a standardized scorecard covering restrooms, party rooms, food service areas, attraction surfaces, and common areas, produces a numerical score and a list of specific deficiencies. The score is tracked over time, and the deficiencies are assigned for correction. Efficiency metrics include labor hours per guest, labor cost per revenue dollar, average check time at the café, average wait time at the front desk, and average session start-on-time percentage. Each of these captures a specific operational discipline, and each has a target against which performance is measured.
Attendance Tracking and Trend Analysis
Attendance is the most basic performance measure and simultaneously one of the most informative when analyzed properly. The raw daily attendance number is of limited value; the interesting questions are how current attendance compares to forecast, to prior periods, and to the park's theoretical capacity, and what drives the variance. A disciplined attendance tracking practice separates the noise from the signal and produces insights that feed directly into marketing, staffing, and pricing decisions.
Attendance should be broken down along multiple dimensions. By day part — morning, afternoon, evening — to identify when the park is full and when it is empty. By day of week — to reveal the weekday-weekend gap and any mid-week patterns. By month — to reveal seasonality. By customer type — birthday party attendee, group event attendee, walk-in, member, online booking — to identify which channels are growing and which are shrinking. Each dimension produces its own trend line, and each trend line is compared against the same period one year prior, two years prior if the data exists, and against the budget or forecast for the current period.
Trend analysis looks for anomalies and for slow-moving patterns. A single bad week can be weather; three bad weeks in a row is a trend that requires investigation. A slow erosion of weekday evening attendance over six months may be invisible day to day but obvious in a twelve-week moving average. A sudden jump in party bookings from a specific zip code after a school district fundraising event points to a repeatable marketing opportunity. The general manager's job is to ask the questions; the data infrastructure's job is to make the answers visible. Parks that invest in better attendance analytics consistently outperform parks that rely on monthly financial statements alone.
Conversion Metrics
Conversion metrics measure the efficiency of the funnel that moves a prospective customer from awareness to a completed visit. They are common in digital marketing but often neglected in physical-venue businesses, which is why the parks that adopt them gain an immediate edge. The funnel typically has five stages: website visitors, booking page visitors, started bookings, completed bookings, and actual attendance. Each stage has its own conversion rate, and the multiplicative product of all five rates is the end-to-end conversion from marketing impression to paid attendee.
Website and booking conversion rates are tracked through the park's digital analytics platform. A website-to-booking-page conversion rate of twenty to thirty percent is typical; a booking-page-to-completed-booking rate of five to fifteen percent is typical. When rates fall below benchmark, the specific page or step where drop-off occurs is identified and addressed through design changes, copy improvements, or price tests. A one-percentage-point lift in booking-page conversion at a park that drives ten thousand booking-page visits per month equals a measurable revenue gain, and the engineering effort to produce that lift is typically modest.
Call-center and walk-in conversion rates are tracked through the point-of-sale and CRM systems. A booking coordinator who answers inbound phone inquiries should log each inquiry and its outcome, allowing management to calculate the inquiry-to-booking conversion and to coach the coordinator on closing technique. A walk-in guest who inquires about a party but does not book immediately should be captured in a follow-up pipeline with a scheduled contact, and the walk-in-to-booking conversion should be a measured metric rather than an unexamined one. Group sales follow the same logic at a slower cadence, with inquiry-to-quote, quote-to-booking, and booking-to-repeat-booking conversions tracked over multi-month windows.
Using Data for Operational Improvement
Data without action is overhead. The value of the performance measurement framework is realized when insights from the data drive specific operational changes that improve specific outcomes. The discipline of converting data to action is one of the most underrated operational capabilities, and it is the differentiator between parks that collect numbers and parks that use them.
The improvement cycle follows a simple loop. A metric is observed to be off target. A hypothesis is formed about the cause. A specific operational change is designed to address the hypothesized cause. The change is implemented for a defined period, typically two to four weeks. The metric is measured during and after the change, with appropriate controls for seasonality and external factors. If the change produced the expected improvement, it is codified into standard operating procedure. If it did not, the hypothesis is revised and a new test is designed. The loop runs continuously, producing a park that gets measurably better over time rather than drifting.
Prioritization of improvement opportunities is itself a discipline. The general manager cannot run ten simultaneous experiments; capacity limits the number to two or three. Opportunities are prioritized by expected impact, by the cost of implementing the change, and by the risk of unintended consequences. A high-impact, low-cost, low-risk change — reshaping the booking page to surface the premium party package more prominently, for example — is an obvious first move. A high-impact, higher-risk change such as repricing admission is a later move that deserves more analysis before implementation. The improvement pipeline should be visible, with current experiments, recently completed experiments, and queued candidates all documented.
Industry Benchmarking
Internal metrics tell the general manager how the park is performing against its own history. Industry benchmarks tell the owner how the park is performing against the broader market. Both perspectives are necessary, and neither is sufficient alone. Benchmarking against the industry reveals whether a park's strong internal growth is actually in line with a rising tide, or whether its flat revenue masks losses of share to better-performing competitors.
Industry benchmarks are available from multiple sources. Trade associations such as IAAPA publish aggregated operating metrics for their members. Consulting firms that specialize in the family entertainment sector publish annual industry reports that include revenue per guest, labor percentage, ancillary attach rates, and capital efficiency ratios. Franchise and multi-unit operators often have internal benchmarks drawn from their own portfolios. Local peer groups sometimes form informal benchmarking circles, sharing anonymized data in exchange for mutual insight. Owners should actively seek out benchmarking data and should treat it as a permanent reference rather than a one-time purchase.
Benchmarks should be used carefully. A park in a dense urban market has different structural economics than one in a rural community, and direct comparisons without adjustment can mislead. The most useful benchmarks are those drawn from venues with similar attraction mixes, similar population density, and similar price positioning. When a metric lags a relevant benchmark, the response is not immediate imitation but diagnosis: what do the benchmark-leading parks do differently, and does that practice apply here? When a metric leads the benchmark, the response is to understand why and to protect the advantage. Benchmarking is a tool for learning, not a scorecard for self-congratulation or self-flagellation.
The Owner's View
The final perspective on performance measurement belongs to the owner. The general manager lives in the daily and weekly metrics. The owner lives in the monthly, quarterly, and annual metrics, with occasional deep dives when something looks off. The owner's dashboard is necessarily smaller and more strategic than the general manager's: it focuses on revenue growth, profit margin, return on invested capital, debt service coverage, and the handful of operational metrics that signal whether the management team is executing. An owner who dives too deeply into daily metrics begins to undermine the general manager; an owner who ignores the monthly and quarterly numbers loses the ability to identify problems before they become crises.
The right cadence for an owner depends on the stage of the business and the confidence in the management team. A new park, a new general manager, or a park under financial stress warrants a weekly review with the general manager and a monthly review of the full financial package. A stable park with a proven general manager warrants a monthly review and a quarterly deeper dive. An investor or passive owner receives a formal monthly or quarterly report package with a standard format, a narrative summary, and a flagged list of items requiring attention. Consistency of format over time allows the owner to see trends without reading every line, which is the entire point of a disciplined reporting structure.
Summary Points
✓Data-driven management has become the operational standard in the activity park industry.
✓A focused set of ten to fifteen KPIs spanning financial, customer.
✓The financial reporting dashboard is reviewed daily by the general manager.
✓Customer feedback is collected through Net Promoter Score surveys, public review monitoring, and passive guest input.
✓Operational metrics including incidents, cleanliness scores, and labor efficiency are leading indicators that surface problems before financial and customer metrics deteriorate.
✓Attendance is analyzed across day part, day of week, seasonality, and customer type, with trend analysis revealing patterns invisible at the daily level.
PART VIII:
MARKETING, LOYALTY, AND GROWTH
Part VIII focuses on filling the park week after week and growing the enterprise beyond a single location. It covers modern customer acquisition across digital and community channels, pricing optimization that lifts revenue without new capital, loyalty programs that deepen relationships and raise lifetime value, and the strategies that take an operator from one successful unit to a scaled multi-unit business and eventual exit. These chapters make the difference between a park that fades after its honeymoon and one that compounds value year after year.
A beautifully designed park with no visitors is an expensive art installation. Customer acquisition — the disciplined process of turning strangers into first-time guests — is the engine that converts capital investment into cash flow and eventually into loyalty. In the family entertainment category, acquisition is uniquely layered because two audiences must be persuaded simultaneously: parents who fund the visit and children who demand it. The marketing funnel that ignores either half tends to misfire. This chapter lays out the channels, tactics, and economics that together form a modern acquisition system for an activity park.
The acquisition playbook described here assumes a local catchment of roughly twenty to forty minutes' drive time, seasonal demand swings, and a meaningful proportion of revenue coming from birthday parties, school groups, and memberships rather than one-off tickets. It is equally applicable to a single neighborhood play zone and a destination family entertainment center. The difference is scale, not principle. A systematic approach to acquisition turns marketing from a line-item expense into a predictable, optimizable growth lever.
The Digital Foundation: Website, SEO, and Online Booking
The park's website is its permanent storefront, open twenty-four hours a day. More than half of family leisure research now happens on mobile devices, often in the fifteen-minute window between when a child asks 'what can we do this weekend' and when a parent needs an answer. A site that loads slowly, hides prices, or buries the booking button loses those conversations before they start. High-quality photography, short video loops of children actually enjoying the zones, transparent pricing, clear opening hours, and a one-tap booking flow are no longer premium features; they are the minimum viable storefront.
Search engine optimization is the second pillar. The queries that matter for an activity park are almost always local and intent-rich: 'trampoline park near me,' 'indoor playground for 4-year-old,' 'kids birthday venue [city].' Winning these queries requires a properly optimized Google Business Profile with up-to-date hours, geotagged photos, booking links, and actively managed reviews. On-page SEO should target the full long tail of parent search language rather than industry jargon. The reward for sustained SEO discipline is compounding free traffic that reduces reliance on paid advertising over time.
Online booking is where intent becomes revenue. A system that shows real-time availability, lets parents add siblings and socks, and emails an immediate confirmation converts materially better than a 'call us to book' link. Integration with the point-of-sale and customer database matters, because every digital booking should automatically enrich the profile used for retention marketing later. The conversion uplift from reducing booking friction typically ranges from fifteen to thirty percent, and the operational savings from fewer inbound phone calls are a welcome bonus. Every field removed from the checkout is money earned.
Social Media, Paid Search, and Performance Marketing
Parents of young children live on Instagram, Facebook, TikTok, and increasingly YouTube Shorts. Each platform demands a different creative register. Instagram rewards aspirational photography of beautifully themed zones and smiling children. Facebook remains the workhorse for local community groups, event promotion, and retargeting. TikTok and Shorts reward short, unpolished, energetic clips that feel more like a friend's phone video than an ad. The common thread across platforms is that authentic, family-first content outperforms corporate brochureware by wide margins.
Paid acquisition sits on top of organic content. Google Search ads capture high-intent queries for parties and admission. Meta ads drive awareness and retargeting within a defined radius, with audiences built around parenting interests, child age ranges, and lookalikes of existing members. A sensible starter mix allocates roughly forty percent of paid budget to Google Search and performance max, forty percent to Meta, and the remainder to experimental channels such as TikTok, local radio spots, or programmatic display. The exact split shifts as the park accumulates first-party conversion data and learns which channels produce the highest-value customers.
Measurement discipline separates professional marketing from spray-and-pray. Every paid channel should be tracked with unique UTM parameters, pixel-based conversion events, and, where possible, offline conversion imports that tie in-park spending back to the original click. The goal is not to report 'likes' but to attribute memberships, parties, and admission revenue to specific campaigns. Once attribution is in place, budget gravitates naturally toward the highest-return channels and the cost of acquiring each customer begins a steady decline.
Content Marketing and Community Engagement
Content marketing builds trust before the first visit. Blog posts, short guides, and videos on topics such as 'how to plan a stress-free fifth birthday party,' 'the developmental benefits of active play,' or 'what to pack for an indoor park visit' position the operator as a helpful authority rather than a salesperson. Parents who consume three or four pieces of a park's content before booking arrive with higher baseline trust, spend more on ancillaries, and churn less from memberships. The content is also a durable SEO asset that continues to attract traffic long after publication.
Community engagement extends the content strategy into two-way conversation. Local parenting Facebook groups, neighborhood Slack or WhatsApp channels, and school PTA networks are where recommendations actually circulate. Being genuinely useful in these communities — answering questions, sharing rainy-day tips, sponsoring local fundraisers — earns organic goodwill that paid media cannot buy. A modest investment of staff time spent monitoring and participating in these forums often produces acquisition results that rival entire paid campaigns, because parents trust other parents more than any banner ad.
User-generated content completes the loop. Parks that design photogenic zones, run small photo contests, and make it easy for parents to tag the venue turn every visitor into a micro-publisher. A single parent post with twenty comments from friends asking 'where is this?' can drive more bookings than a week of paid ads. Staff should be trained to spot shareable moments and offer gentle prompts, and the park's social accounts should repost the best guest content with credit. Over time, this creates a self-sustaining content flywheel.
Local Partnerships: Schools, Daycares, and Businesses
Local partnerships convert the park from a standalone venue into a node in the community's family ecosystem. Schools and daycares are natural allies because they have pre-aggregated audiences of exactly the right demographic. Structured programs — field trips with an educational overlay, end-of-year class parties, reward days for reading challenges, teacher appreciation events — bring entire cohorts through the doors at once and plant a seed that converts into birthday bookings and memberships over the following months.
Daycares and preschools deserve their own partnership track. A weekday-morning program priced to utilize otherwise empty capacity benefits both sides: the daycare gets an enrichment outing without operational hassle, and the park fills its lowest-demand hours with paying guests who also tell their parents about the experience. Bundled pricing, reserved time slots, and dedicated staff support make these programs replicable across dozens of institutions within a catchment area. The marginal revenue is high because fixed costs are already covered by peak sessions.
Cross-promotion with complementary local businesses amplifies reach at near-zero cost. Family restaurants, children's hair salons, pediatric dentists, kids' clothing stores, and toy shops all serve overlapping audiences without direct competition. Reciprocal flyer placement, joint Instagram giveaways, and co-branded discount cards move customers between venues. Hotels and short-stay rental operators in tourist-adjacent locations can become particularly valuable partners, steering visiting families toward the park as a guaranteed way to tire out the children before dinner.
Influencer Marketing and Brand Ambassadors
Influencer marketing, when executed with discipline, delivers some of the lowest acquisition costs available to a local park. The most productive tier is not celebrity influencers but local micro-influencers with one thousand to ten thousand highly engaged followers in the park's catchment area. A family lifestyle blogger with six thousand local followers often drives more bookings than a national account with a million, because the audience overlap is near-total and the recommendation feels personal rather than sponsored.
The structure of an influencer partnership matters as much as the selection. Rather than one-off paid posts, operators should build ongoing relationships with a small stable of ambassadors who visit repeatedly, cover seasonal events, and share authentic family moments. Unique promo codes tied to each ambassador make attribution transparent and allow performance comparisons. Compensation can blend free membership, party credits, cash fees, and performance bonuses, with the exact mix negotiated based on audience size and engagement rates rather than follower count alone.
Brand ambassadors drawn from the existing member base often outperform paid influencers. A 'Founding Family' or 'Ambassador Tier' program identifies members who already refer friends, post organically, and attend events, then formalizes their status with visible perks: exclusive previews, quarterly meetups, input into new attractions, and a dedicated ambassador lanyard. Because these advocates pay for their own memberships, their endorsements carry unmatched credibility. The program simultaneously reduces acquisition costs and deepens loyalty among the advocates themselves, a dual benefit that pure paid influencer deals cannot replicate.
Referral Programs and Word-of-Mouth
Word-of-mouth is the single most efficient acquisition channel in family entertainment, and the good news is that it can be engineered rather than merely hoped for. A well-designed referral program turns satisfied customers into a distributed sales force by giving both the referrer and the new customer a meaningful reward. Double-sided incentives — for example, one free month added to the referrer's membership and a discounted trial for the new family — consistently outperform one-sided schemes because they remove the social awkwardness of the ask.
The mechanics of the program should be as frictionless as possible. A personalized referral code displayed in the member app, a prefilled text message template, and a visible progress tracker showing pending and successful referrals all reduce the cognitive effort of participating. Birthday parties are a particularly fertile referral surface because each event brings a dozen or more warm leads whose children have just experienced the park firsthand. Structured post-party follow-up sequences convert these leads at far higher rates than cold prospecting.
Tracking referral performance rigorously reveals which member segments drive the most valuable new customers. Typically a small minority of members — often ten to fifteen percent — generate the majority of referrals. Identifying these 'super-referrers' early and recognizing them publicly, whether through a leaderboard, exclusive events, or tangible thank-you gifts, creates a reinforcing loop that multiplies their activity. Combined with the ambassador program described earlier, this approach can push organic acquisition to more than forty percent of new customers in mature parks.
Event Marketing and Public Relations
Events turn a park from a transactional venue into a living brand. Seasonal signature events — Halloween glow nights, winter wonderland weekends, summer superhero camps, spring breakfast-with-characters mornings — create natural pegs for media coverage, social content, and repeat visits from existing members. A calendar of eight to twelve tentpole events per year gives the marketing team fresh material every four to six weeks and trains the audience to check back regularly for the next announcement.
Public relations complements paid marketing by lending third-party credibility. Local television morning shows, parenting magazines, and community newspapers are perpetually hungry for human-interest stories: the grand opening of a new zone, a charity fundraiser, a record-breaking birthday weekend, a behind-the-scenes look at how attractions are designed. Operators who cultivate journalists with advance invitations, exclusive previews, and genuinely newsworthy stories earn coverage that would cost tens of thousands of dollars to buy as advertising.
Community events extend the park's footprint beyond its walls. Participating in local fairs, sponsoring youth sports leagues, and hosting free community days for underserved families build goodwill that converts into bookings and membership conversions over time. These initiatives also generate the kind of feel-good content that performs well on social media and strengthens the park's positioning as a community institution rather than just another commercial venue. The returns are slower than a performance ad, but the brand equity accumulated is far more durable.
Customer Acquisition Cost and Lifetime Value
Customer acquisition cost, or CAC, is the total marketing and sales spending required to produce one paying customer. For a local activity park, CAC is calculated by summing paid media, agency fees, promotions, and the loaded cost of marketing staff, then dividing by the number of new customers acquired in the same period. Industry benchmarks in family entertainment typically fall between two hundred sixty and three hundred thirty dollars per acquired customer, though disciplined operators with strong organic channels can reduce this meaningfully through referral and content strategies.
Lifetime value, or LTV, is the total gross profit a typical customer generates across the entire duration of their relationship with the park. For a single-visit customer LTV might be twenty dollars of contribution margin. For an annual member with ancillary spend and party bookings it can easily exceed one thousand dollars. Calculating LTV requires honest inputs: realistic retention curves, actual ancillary spend per visit, and appropriate gross margin assumptions rather than top-line revenue. The exercise often reveals that memberships and party hosts are many times more valuable than walk-in admission buyers.
The CAC-to-LTV ratio is the single most important diagnostic of marketing health. A ratio of three to one — three dollars of lifetime value for every dollar of acquisition cost — is the widely accepted benchmark for a sustainable business. Ratios below two to one signal that the park is buying revenue rather than building value. Ratios above five to one often indicate that the park is underinvesting in growth and leaving market share on the table. The industry average in entertainment sits near two-and-a-half to one, which means most operators have material room to improve either by reducing CAC, increasing LTV through loyalty programs, or both.
Translating these ratios into action requires segmentation. CAC and LTV should be computed separately for admission buyers, party customers, members, and corporate event clients, because each segment has dramatically different economics. Marketing budgets should then be reallocated toward the channels and campaigns that produce the highest-LTV customers, not simply the cheapest clicks. Over time this segmented approach shifts the customer mix toward higher-value cohorts and compounds profitability without requiring additional marketing spend.
Summary Points
✓Acquisition in family entertainment requires convincing two audiences simultaneously , the parent who pays and the child who demands.
✓A fast, mobile-optimized website with real-time online booking is the non-negotiable foundation. every field of friction removed from checkout increases conversion by double-digit percentages.
✓Local SEO, a well-tended Google Business Profile, and active review management capture the high-intent 'near me' searches that dominate parent discovery behavior.
✓A balanced paid-media mix of Google Search, Meta, and experimental channels, tracked with rigorous attribution.
✓Content marketing and authentic participation in local parenting communities build the trust that paid media alone cannot buy.
✓School, daycare, and cross-business partnerships aggregate audiences efficiently and fill off-peak capacity at high marginal contribution margins.
Pricing is the fastest lever a park operator can pull to change profitability. Unlike adding attractions, hiring staff, or opening new locations, a pricing change can be tested on Monday and measured on Friday. It is also the lever most commonly left idle. Many parks set a single admission price at opening, adjust it grudgingly every few years, and discover only in hindsight how much revenue they surrendered to an unsophisticated pricing model. This chapter lays out a modern, data-driven approach to pricing that treats every ticket, membership, and package as a variable rather than a fixed number.
The principles that follow draw on yield management practices pioneered in airlines and hotels, behavioral pricing research, and the specific demand patterns of family entertainment. They assume an operator willing to use software, run experiments, and accept that a portion of guests will pay different prices for similar experiences. That willingness is the price of admission to professional pricing, and the revenue uplift — commonly five to twenty percent without any change in volume — is the reward.
Dynamic Pricing and Yield Management
Dynamic pricing adjusts admission and package prices in response to demand signals rather than holding them constant. The signals include day of the week, time of day, school calendar, weather forecast, local events, booking lead time, and current capacity sold. A Tuesday morning in March behaves nothing like a Saturday afternoon in December, and charging the same price for both leaves money on one side and empty lanes on the other. Dynamic pricing recognizes this reality and adjusts accordingly.
Implementation does not require building a proprietary algorithm from scratch. Specialized attractions pricing platforms now provide rules-based engines and machine-learning models that ingest historical bookings, competitor prices, and real-time demand to recommend prices by session. Operators retain control via floor and ceiling prices, sensitivity settings, and override authority. The typical adoption path begins with weekday-versus-weekend tiering, progresses to peak-hour premiums, and eventually moves to full session-level dynamic pricing once the team is comfortable with the mechanics.
The case for yield management is empirical. Major operators such as Disney, Universal, and Merlin Entertainments have used dynamic pricing for years and report material revenue increases alongside improved guest experience, because higher prices at peak times deter marginal visitors and reduce crowding. Smaller regional parks that have adopted similar models report revenue uplifts in the five-to-twenty-percent range with no change in underlying capacity. The capital requirement is modest, the software cost is straightforward, and the returns are typically measurable within a single season.
Promotional Calendars and Seasonal Campaigns
A promotional calendar is the annual choreography that ties marketing, operations, and pricing to the rhythm of the family year. School holidays, long weekends, the back-to-school window, the holiday season, summer break, and local festival dates should all be mapped twelve months in advance, with pricing, staffing, and campaign creative planned against each peg. This calendar becomes the master document around which every downstream decision aligns, from food orders to paid media budgets.
Seasonal campaigns provide both urgency and freshness. A spring break 'Play Pass' bundle, a summer camp series, a Halloween glow-night ticket, a holiday 'twelve days of play' punch card, and a new-year fitness-themed family challenge each create natural reasons to market, to email, and to raise or discount prices for a defined window. Because the campaigns are time-bounded, they invoke scarcity and urgency without training the audience to expect perpetual discounts. Over time the calendar itself becomes a brand asset as families anticipate recurring signature events.
The pricing architecture within a seasonal campaign matters as much as the theme. Early-bird rates, member-exclusive windows, and limited allocations of premium-experience add-ons all allow the operator to capture willingness-to-pay differences across segments. A family that books six weeks ahead for a Halloween event is more price-sensitive than one deciding on the Friday of the event weekend; smart campaign pricing rewards the former with savings and captures the latter at a premium. The result is higher total revenue from the same event footprint.
A/B Testing for Pricing
Intuition is an unreliable pricing guide. A/B testing replaces intuition with evidence by presenting different prices, bundles, or framings to statistically comparable audiences and measuring the resulting behavior. Online booking platforms make this experimentation straightforward: one cohort sees a $24.99 admission, another sees $27.99; conversion rates, average basket size, and downstream retention are tracked. Over dozens of such tests, a clear map of the park's price-response curve emerges.
Effective pricing tests require discipline. Each test should isolate a single variable, run long enough to reach statistical significance, and measure not just conversion but eventual revenue and retention, because a cheaper price that attracts lower-quality customers can damage long-term economics. Tests should also be sequenced to avoid confounding: running a price test during a heavy promotional campaign produces noise rather than signal. A dedicated testing cadence — for example, two experiments per month during shoulder seasons — builds a reliable knowledge base over time.
The tests that often deliver the largest surprises are framing tests rather than raw price tests. A membership sold as '$33 per month' converts differently than the same membership sold as '$399 per year,' even when the economics are identical. A birthday package framed as 'includes 15 pizzas' reads differently than 'includes pizza for every guest.' Testing these framings reveals how parents actually process price information, which almost always differs from how the operator assumes they do.
Price Elasticity and Demand Response
Price elasticity measures how sensitive demand is to price changes. An elasticity of negative one means a ten-percent price increase produces a ten-percent volume decrease, leaving revenue unchanged. Anything less elastic — for example, negative zero-point-five — means revenue rises with price. Premium family entertainment destinations such as Disney have repeatedly demonstrated inelastic demand, which is why they have raised prices faster than inflation for decades without losing attendance. Regional activity parks sit on a wider elasticity spectrum depending on their competitive moat and brand strength.
Measuring elasticity at a specific park requires systematic variation and observation. Historical sales data from periods with different prices provides a starting estimate, but deliberate experiments yield cleaner numbers. Elasticity also varies by segment: members are typically less price-sensitive than walk-ins, weekend peak visitors are less sensitive than weekday off-peak visitors, and birthday hosts are far less sensitive than admission buyers. Segment-level elasticity estimates enable precise price discrimination rather than blunt across-the-board adjustments.
The strategic implication is that most parks under-price their peak segments and over-price their off-peak segments. A careful reallocation — raising Saturday afternoon prices by ten percent while cutting Tuesday morning prices by twenty percent — often increases total revenue while simultaneously flattening demand and improving the guest experience through reduced crowding. The same logic applies to premium experiences, VIP add-ons, and party packages, where elasticity is consistently lower than operators assume. Leaving these premium tiers underpriced is one of the most common and costly mistakes in the industry.
Membership Conversion Strategies
Memberships convert transactional guests into recurring revenue, and the pricing architecture of the membership is the single largest determinant of conversion rates. Price anchoring is the foundational technique: when a single visit costs $25 and a five-visit pack costs $100, an annual membership at $299 becomes financially compelling after just twelve visits. Displaying the math explicitly — 'breaks even after 12 visits; average member visits 28 times per year' — shifts the decision from 'is this expensive' to 'am I the type of family that visits enough.'
Tiered membership structures capture different willingness-to-pay levels within the same product family. A three-tier architecture typically works well: a value tier restricted to off-peak hours, a standard tier with unrestricted access, and a premium tier adding priority booking, guest passes, and exclusive events. The pricing gaps between tiers should be wide enough to segment the audience but narrow enough to encourage upgrades. A well-calibrated ladder produces a roughly 20-60-20 distribution across tiers, with the standard tier anchoring the middle and the premium tier providing disproportionate contribution margin.
Conversion tactics should target the highest-intent moments. The end of a first visit, the conclusion of a birthday party, and the completion of a multi-visit pack are all natural conversion triggers. A well-trained front-desk team armed with a simple script — 'you've just spent $80 today; a membership would have covered that and given you unlimited visits this month' — routinely doubles conversion rates compared with passive signage. Automated follow-up emails and retargeting ads reinforce the message to guests who did not convert on the spot, often producing a second wave of sign-ups within seventy-two hours.
Bundling and Package Design
Bundling increases average transaction value by combining individually priced items into a package that feels like a deal while actually producing higher margin. A birthday party priced as 'ten children, two hours, private room, pizza, soft drinks, and a goody bag for $399' is both easier to sell and more profitable than the same components priced à la carte, because parents value simplicity and the operator captures attachment spending that might otherwise be lost. The art of bundling lies in choosing components that are low marginal cost to the park but high perceived value to the customer.
Package tiering follows the same logic as membership tiering. A 'Classic,' 'Premium,' and 'Ultimate' birthday package ladder guides hosts toward the middle option through well-documented 'compromise effect' behavior, in which consumers avoid both the cheapest and the most expensive option and gravitate toward the option that feels balanced. Premium tiers should include genuinely differentiated elements — a character appearance, a themed cake, a photography package, a private VIP entrance — rather than merely larger quantities of the base experience. The presence of the premium tier itself makes the standard tier look like better value.
Dynamic bundling extends these ideas to the individual visit. After a guest adds admission to the cart, the booking system can intelligently suggest an arcade card, a food-and-drink combo, or a socks-and-water-bottle bundle at a modest discount. Well-designed cross-sells typically lift average basket size by ten to twenty percent and require no additional marketing spend because they ride on top of demand the park has already earned. The same logic extends to on-site point-of-sale, where café bundles, arcade-card add-ons, and photo packages can be merchandised with the same discipline that online retailers apply to their checkout flows.
Upselling and Cross-Selling Tactics
Upselling moves a customer up the value ladder; cross-selling adds adjacent purchases. Both are dramatically more profitable than acquiring new customers, because the marketing cost has already been absorbed. A guest who has driven to the park, paid for admission, and brought hungry children is already in a receptive state for food, arcade credits, merchandise, and upgraded experiences. The operator's job is to make those offers visible, relevant, and easy to accept.
Staff training is the highest-leverage investment in upsell performance. A front-desk associate who asks every guest 'would you like to add the unlimited-time upgrade for $8 today?' will convert a meaningful percentage, and the incremental revenue compounds across thousands of transactions. Scripted suggestions, competitions among staff with small rewards for the top upseller of the month, and clear performance tracking turn upselling from a sporadic exercise into an operational discipline. The guest experience improves simultaneously because guests genuinely enjoy the added value.
Digital upselling complements the in-person kind. Pre-visit emails can offer discounted arcade-card top-ups, post-visit emails can promote party bookings or membership conversion, and in-app notifications can suggest upgrades during the visit itself. The data generated by these interactions feeds back into segmentation models that identify which offers work for which guest profiles, so the system becomes more accurate over time. In mature parks, digital cross-sell alone can contribute five to ten percent of total revenue with near-zero marginal cost.
Revenue Management Tools and Dashboards
Revenue management is a team sport that requires the right instruments. Modern venue management platforms combine booking, point-of-sale, memberships, and marketing into a single database from which a dedicated revenue manager can monitor capacity utilization, average revenue per visitor, attach rates, and conversion funnels in near-real time. Dashboards should display not only what happened yesterday but also forecast utilization for the next fourteen days so that the team can adjust prices, promotions, and staffing proactively.
Key performance indicators for the revenue management function include revenue per available hour, average spend per guest, member conversion rate, ancillary attach rate, and price realization versus rack rate. Benchmarking these figures internally across days, months, and seasons surfaces opportunities that raw revenue totals hide. A weekend with strong admission revenue may nonetheless be underperforming on ancillary spend relative to the comparable weekend a year earlier, and only segmented KPIs will flag the gap in time to act on it.
The organizational implication is that pricing and revenue management deserve dedicated ownership rather than being scattered across marketing, operations, and finance. In a single-location park that ownership can rest with the general manager or marketing lead, but it should be named and measured. In multi-location operations, a centralized revenue management function that sets pricing guardrails, runs A/B tests across sites, and shares best practices delivers outsized returns on a modest headcount investment. The discipline scales elegantly because the underlying principles are identical regardless of park size.
Summary Points
✓Pricing is the fastest lever for profitability. a single well-executed pricing change can deliver in a quarter what operational improvements deliver in a year.
✓Dynamic pricing and yield management, enabled by modern attractions platforms, typically increase revenue by 5-20% without any change in capacity or staffing.
✓A twelve-month promotional calendar tied to school holidays, seasons, and signature events provides both structure and urgency.
✓A/B testing replaces pricing intuition with evidence and often reveals that framing effects matter as much as raw price levels.
✓Elasticity varies by segment: peak visitors, members, and birthday hosts are consistently less price-sensitive than operators assume, and premium tiers are routinely under-priced.
✓Membership pricing anchored against high single-visit rates, combined with a three-tier architecture, converts transactional guests into recurring revenue customers.
Acquisition fills the park; loyalty pays for it. A family that returns thirty times a year, books two birthday parties, buys arcade credits on every visit, and tells four other families about the place is worth a multiple of any single-visit guest. And yet most loyalty programs in the family entertainment industry remain shallow, offering little more than a stamp card or a tenth-visit-free discount. The operators who win the next decade will be those who treat loyalty as the central strategic discipline of the business, built on behavioral science, executed through digital tools, and measured with precision.
This chapter presents a modern loyalty architecture designed specifically for activity parks. It begins with the dual-stakeholder reality that every program must satisfy both parents and children, then lays out the behavioral economics principles that make programs stick, then walks through ten concrete program models drawn from deep research into what actually works. It closes with the metrics, segmentation, and win-back mechanics that sustain loyalty once built. Readers should expect this chapter to be longer and more tactical than its neighbors, because loyalty is where the competitive moat of a park is ultimately dug.
Loyalty as Competitive Advantage
A well-designed loyalty program changes the economics of the business in three ways simultaneously. It raises lifetime value by increasing visit frequency, ancillary spend, and membership tenure. It reduces customer acquisition cost because retained members refer other families at rates paid channels cannot match. And it compresses price elasticity because loyal members value the relationship beyond the transaction, allowing the operator to price more aggressively during peak periods without losing the core audience. Each of these effects is significant on its own; together they compound into a defensible competitive moat.
The traditional failure mode is to equate loyalty with discounting. A tenth-visit-free card is not loyalty; it is a coupon with a longer fuse. True loyalty is an attitudinal state in which the customer would choose the brand even if a competitor offered a lower price, because the relationship has acquired emotional and social weight that a discount cannot match. Programs that cultivate this attitudinal loyalty consistently outperform transactional discount schemes on every downstream metric that matters.
The competitive implication is that loyalty is increasingly the primary battleground in family entertainment. Attractions can be copied, prices can be matched, and marketing tactics can be imitated. What cannot be easily replicated is the cumulative emotional investment of hundreds of families who have celebrated birthdays, earned streak badges, built friendships with staff, and watched their children grow up inside a specific venue. Operators who invest early in the mechanisms that accumulate this investment build a lead that late-arriving competitors struggle to close.
The Dual-Stakeholder Model: Parents and Children
An activity park serves two decision-makers simultaneously: the parent who controls spending and the child who controls demand. Most loyalty programs in the category target one and neglect the other, which explains why so many fail to produce durable repeat behavior. A program that delights children but irritates parents creates tension at home and suppresses visits. A program that satisfies parents but bores children collapses under the weight of the child's shifting interests. Only programs that simultaneously reinforce both sides of the dyad produce the self-sustaining loop of repeat attendance.
Parent attitudinal loyalty is driven by rational and semi-rational factors: safety, cleanliness, staff quality, perceived developmental value, convenience of booking and parking, and honest value for money. Parents ask themselves 'is this a good choice for my child and our family?' A program that gives parents visible proof of developmental value — achievement certificates, progress reports, photos of their child mastering new skills — provides the justification they need to continue spending. When parents share these proofs on social media, the family's public identity becomes associated with the park, deepening loyalty further.
Child attitudinal loyalty is driven by emotional and experiential factors: the intensity of fun, the novelty of each visit, a sense of mastery, social belonging with peers, and public recognition of achievement. Children ask 'do I want to go back?' and the answer is shaped as much by what happened at the peak and end of the last visit as by the average quality of the experience. Programs that create engineered peak moments and strong closing rituals plant memories that pull children back weeks later, often pestering their parents to rebook before the weekend arrives.
The ideal state — described in the source research as the 'Ideal Zone' — is reached when parent and child loyalty are both high and actively reinforce each other. The child's persistent requests provide the parent with emotional evidence that the money was well spent; the parent's continued investment reassures the child that the relationship is stable. In this zone, renewals become automatic, referrals become natural, and price sensitivity drops sharply. Everything that follows in this chapter is designed to move families into that zone and keep them there.
Behavioral Economics Foundations
Behavioral economics is the study of how people actually make decisions, as opposed to how classical economics assumes they do. Real parents are tired, distracted, and comparing options quickly on their phones. Real children are driven by immediate feelings, social comparison, and vivid memories. Loyalty programs that ignore these realities and assume rational optimization fail predictably. Programs that design with cognitive biases in mind feel natural to users even as they steadily move behavior in the operator's preferred direction.
Loss Aversion
Loss aversion is the finding that people feel losses roughly twice as intensely as equivalent gains. Losing a ten-dollar bill hurts more than finding one delights. For loyalty programs, this means that framing benefits as things the customer could lose produces stronger action than framing them as things the customer could gain. A renewal reminder that says 'renew by Friday to keep your Gold status and locked rate' outperforms one that says 'renew by Friday to receive Gold benefits,' even though the economic substance is identical.
Practical applications in activity parks include streak programs that accumulate over weeks and break painfully if missed, tier protection that warns members of imminent demotion, price-lock guarantees that expire if the member lapses, and points or credits that carry expiration dates if unused. Each of these mechanics creates a small emotional cost to inaction, which reliably moves a percentage of otherwise-dormant members into activity. The operator must use these tools ethically — loss framing should protect genuine value, not manufacture anxiety — but within those bounds the results are consistent and significant.
Goal-Gradient Effect
The goal-gradient effect describes the observation that motivation increases as a person approaches a goal. Runners sprint the final mile, students cram harder as finals approach, and children accelerate effort when a reward is visibly within reach. Loyalty programs that make progress visible and goals proximate exploit this effect to drive behavior that otherwise would not occur. A points balance displayed alongside a progress bar to the next reward produces materially more engagement than the same points shown as a flat number.
In practice, this translates into visible progress bars in the member app, notifications such as 'you are three visits away from your dream prize,' missions and challenges with explicit completion percentages, and tier ladders that show the member exactly how much more activity is required to unlock the next level. The principle also informs reward design: offering a mix of near-term rewards and long-term aspirational prizes ensures that the member always has a goal within striking distance, so motivation never fully dissipates.
Peak-End Rule
The peak-end rule holds that people judge an experience not by its average quality but by the intensity of its most memorable moment and the quality of its final moment. A two-hour visit with one surprise character appearance and a rousing closing ceremony will be remembered as excellent, even if the intervening ninety minutes were merely ordinary. A visit of uniformly good quality with a frustrating exit experience will be remembered as disappointing, because the end moment dominates memory.
This is one of the most actionable principles in loyalty design. Operators should deliberately engineer peaks into every visit: surprise staff recognition, unexpected character appearances, a special-effects moment, a public celebration of an earned badge. They should equally engineer endings: achievement stamps at the exit, a closing circle, a photo station, a small parting gift. Post-visit communications should then reinforce these peak moments with photos and highlight reels, extending the memory beyond the visit itself and strengthening the emotional residue that drives rebooking.
Endowment Effect and Ownership
The endowment effect is the tendency to value things more once they feel owned. A mug the subject has held for thirty seconds becomes more valuable to them than an identical mug they have not held. For loyalty programs, the implication is that any mechanism that gives the member a sense of ownership over an aspect of the park — a personalized avatar, an accumulated points balance, a named tier status, a chosen identity path such as Explorer or Creator — increases emotional attachment and raises the pain of leaving.
Activity parks can exploit this principle through personalization at every touchpoint. Children choose an in-park persona with its own badge color. Members see their family name displayed on achievement walls. Streak badges accumulate on the member app home screen where the child sees them daily. Each element creates a small but cumulative sense of 'this place is ours,' and the psychological cost of abandoning these accumulated possessions becomes a real retention mechanism. The effect is especially strong when items are hard-earned rather than gifted, because the effort invested amplifies perceived ownership.
Social Proof and Belonging
Social proof is the heuristic that people use others' behavior as a guide for their own. Parents trust other parents' choices; children want what their peers have. Loyalty programs that make the community visible convert social proof into a recruitment and retention engine. Member walls, leaderboards, ambassador lanyards, photos from member-only events, and simple copy such as 'join 500 member families' all activate the sense that belonging to the program is the normal and desirable choice for people like the prospect.
Social proof also works in-visit. A Master Zone that is physically visible from the Explorer Zone but accessible only to tier members creates visible aspiration. Children who see other children wearing Master wristbands inside that zone naturally want the same status, and parents who observe the visible differentiation understand the value without a sales pitch. The same dynamic works for ambassador lanyards, founding-member badges, and any other public marker of status. Designed well, these markers become objects of desire that members work to earn and then proudly display.
Additional Cognitive Biases in Loyalty Design
Several further biases round out the loyalty toolkit. Anchoring causes the first number a customer sees to dominate subsequent evaluations, which is why a single visit displayed at fifty dollars makes an annual membership at three hundred ninety-nine dollars feel like a bargain. Scarcity and urgency, such as limited monthly collectible cards or countdown timers for renewal benefits, exploit loss aversion and fear of missing out to accelerate decisions. Commitment and consistency lead customers who have taken a small action — accepting a free trial or signing up for a newsletter — to take larger actions later to remain consistent with their self-image.
Reciprocity is activated by unexpected gifts and surprise rewards, which create a psychological obligation to give back through continued loyalty. Framing effects ensure that identical economic offers produce different responses depending on wording, which is why every major communication should be A/B-tested across gain and loss frames. Present bias, or hyperbolic discounting, explains why immediate small rewards often outperform larger delayed ones, which informs the design of in-app notifications and same-day incentives. The default effect, finally, means that whichever option is pre-selected will be chosen by the majority; making auto-renew the default membership option often lifts retention by ten points or more.
The Ten Loyalty Program Models
The following ten program models, drawn from detailed research into what works in children's activity parks, provide a complete architecture for loyalty. They are not mutually exclusive; a mature park deploys most or all of them in a coordinated system. Each program is designed to target specific loyalty dimensions rather than generic 'overall loyalty,' and each is measurable and testable through controlled experiments. Read together, they form the operational backbone of the chapter.
Model 1: Annual Membership with Smart Scheduling
The anchor program of any loyalty architecture is the annual membership, designed to convert single-visit and multi-visit purchasers into auto-renewing members. A three-tier structure works reliably: a Weekday-Mornings tier priced around $299 restricted to Monday through Friday before 2 PM; an Anytime Standard tier at roughly $399 with unrestricted access; and an Anytime-Plus Premium tier near $549 with priority booking, guest passes, and Master Zone preview tokens. Single-visit admission at $50 and a five-visit pack at $200 anchor the math so that the membership breaks even after six to eight visits, making it financially undeniable for any family that visits two to four times a month.
The behavioral mechanics baked into the membership matter as much as the price. A Price Lock Guarantee uses loss aversion to motivate renewal ('renew now to keep your current rate forever'). Monthly autopay is the default option, removing friction and exploiting the default effect. Bundled benefits — café discounts, birthday credits, guest passes, pause protection — create mental accounting that makes the total package feel far more valuable than the sum of its parts. Pause protection, which allows one no-cost pause month per year, removes the most common objection to annual commitment without meaningfully reducing tenure.
Model 2: Play-to-Earn Points Economy with Prize Ladder
A points economy creates long-term behavioral loyalty, especially among children, by leveraging the goal-gradient effect and delayed gratification. Members earn 100 base points per visit, 50 to 150 bonus points for daily missions, 200 streak bonus points for four or more consecutive weekly visits, 25 points for staff-awarded kindness recognition, double points during birthday month, and 500 bonus points for a successful friend referral. Points accumulate in a visible wallet that the child checks between visits, each look reinforcing the desire to return.
The redemption ladder uses three tiers to keep motivation alive across time horizons. Small rewards at 200 to 500 points — stickers, tattoos, small toys — provide immediate gratification that satisfies present bias. Mid-tier rewards at 1,000 to 2,500 points — branded plushies, magnets, water bottles — serve as three-to-six-month targets. Dream prizes at 5,000 to 10,000 points — a robotics kit, a gaming console, a premium bicycle — become twelve-to-eighteen-month aspirational goals that anchor the child's long-term engagement. The combination ensures a reward is always within reach while a larger goal pulls the child forward.
Model 3: Trade Cards and Collectibles Economy
A trade card economy creates obsessive engagement through collectible scarcity, social trading, and set-completion psychology. Card types include character cards, zone mastery cards, seasonal limited editions, rare holographics, and monthly 'drop' cards that appear only for a thirty-day window before disappearing forever. Distribution combines guaranteed mechanics — one card per visit, bonus cards for streaks and referrals — with variable-reward mechanics such as mystery envelopes at checkout, which produce the same dopamine pattern that makes slot machines compelling.
The social dimension multiplies the effect. Children trade cards with each other at the park and at school, making the park's branding a natural part of peer conversation. Parents report that trade cards become the topic their children raise most frequently between visits, pulling them back sooner than any marketing email could. The cost to the park of producing a card is trivial; the incremental visit and referral value each card generates is substantial. This is one of the highest-return initiatives in the entire loyalty toolkit.
Model 4: Streak and Habit Building Program
Streak mechanics convert irregular visitors into weekly habitual attenders through a carefully tuned combination of loss aversion, sunk-cost bias, and commitment effects. The program tracks consecutive weekly visits in the member app, displays a visible streak counter, awards milestone badges at four, eight, twelve, and twenty-six weeks, features a streak wall inside the park celebrating champions, and maintains a participation-based leaderboard rather than a purely competitive one. The visible accumulation creates the psychological investment that makes breaking the streak painful.
Streak protection mechanisms prevent the brittleness that would otherwise cause members to abandon the program after a single missed week. Each member receives one 'streak freeze token' per month that preserves their streak if used before the deadline. 'Streak at risk' notifications go out on Friday afternoons to members who have not yet booked that week. Special 'streak saver weekend' sessions are scheduled to give members a convenient rescue option. Double points are awarded for maintaining four-week streaks, creating both acceleration and a consolation gain that softens the sting of eventual breakage.
Model 5: Birthday-to-Member Conversion Funnel
Birthday parties are the single richest acquisition surface available to an activity park. Every party brings ten to twenty warm leads — children who just experienced the peak of the park's product and parents who watched their own children having fun. A systematic conversion funnel captures these leads rather than letting them evaporate. Every party guest receives an Explorer trial pack, a Master Zone preview token, a birthday-edition trade card pack, and a memorable VIP treatment for the birthday child that anchors the memory.
The post-event sequence exploits the peak-end rule and temporal landmarks. Within twenty-four hours, a thank-you email with a highlight photo from the party lands in the parent's inbox, reactivating the emotional peak. Three days later, a social-proof message notes that the child's friends loved the event and includes a limited-time trial offer. Seven days after the party, an urgency-framed message offers a bonus for joining by a specific date. Birthday hosts themselves receive rewards when their guests convert, turning every party into a referral engine. Conversion rates from this sequence frequently exceed twenty percent, which is an exceptional yield on effectively free leads.
Model 6: Dual-Sided Referral and Ambassador Program
Double-sided referrals, in which both the referrer and the new member receive a meaningful reward, consistently outperform one-sided schemes because they remove the social awkwardness of asking. The referrer receives one free membership month plus a rare trade card and a Master credit for each successful referral. The new family receives a discounted trial and the same rare trade card, which instantly creates a shared artifact between the two families. The double-sided structure frames the referral as mutual benefit rather than favor-seeking.
A formal ambassador tier rewards members who exceed three successful referrals. Ambassadors receive exclusive event invitations, a mission checklist with additional rewards, a public leaderboard placement, a distinctive lanyard that activates visible status, and 'Top Contributor Family' recognition at annual gatherings. The ambassador program combines reciprocity, social proof, status bias, and in-group identity into a single mechanism that both amplifies referrals and deepens the ambassador's own attachment to the brand. Mature parks typically generate thirty to forty percent of new members through referral and ambassador channels.
Model 7: School and Institutional Partnership Ladder
Systematic partnerships with schools, homeschool networks, and educational institutions create group loyalty and fill weekday-morning capacity at high margin. The ladder begins with field-trip packages that include curriculum-aligned workshops and STEM activities, progresses to homeschool semester cohorts with quarterly graduation events, and extends to school-versus-school mission leaderboards that produce friendly competition. Teacher family passes and teacher referral codes turn educators into unpaid ambassadors within their own networks.
The behavioral underpinnings of the school program are distinct from individual membership. In-group bias and social identity theory drive entire cohorts to adopt the park as 'their' venue. Authority endorsement from teachers and principals carries weight with parents that no direct marketing can match. Community embedding, finally, ensures that the park becomes woven into the calendar of local childhood rather than remaining a discretionary outing. The revenue stream is predictable, the margin is high because capacity would otherwise be empty, and the long-term effect on the brand's local standing is substantial.
Model 8: Master Zone Progressive Access System
Physical zoning creates aspiration, status differentiation, and upgrade motivation in ways that pricing alone cannot. The park is divided into an Explorer Zone with open access and a Master Zone with premium access restricted to members and eligible tier holders. Crucially, the Master Zone is visually accessible from the Explorer Zone — a glass wall, a mezzanine view, or an open courtyard — so that non-members can see the members-only experience and develop aspiration.
Master Access is operationalized through scheduled sessions with controlled capacity, visible wristbands that function as status markers, Master-only equipment or challenge stations, and Master-only time windows during peak hours. Progression is formalized through an Explorer-to-Master ladder that members traverse by completing challenges or accumulating points, and trial entry points — a Master Preview Pass for birthday guests, a first-session-free promotion for new members — seed the upgrade pipeline. The combination activates aspiration effect, status bias, visible differentiation, and the goal-gradient effect in a single integrated design.
Model 9: Secondary Spend Maximization System
Every visit, including free or promotional ones, should generate secondary revenue beyond base admission. The secondary spend system uses points and bundling to encourage food-and-beverage purchases, gift store transactions, and premium add-ons without feeling transactional. Café bonus points, gift store double-points days, 'spend $10 get 100 points' promotions, and points multipliers during off-peak times reframe ancillary spending as reward acceleration rather than incremental cost.
In-visit upsells layer additional revenue on top of secondary spending. Limited-edition seasonal merchandise, bundled food-plus-Master-workshop packs, in-app upsell prompts for premium experiences, mystery chest purchases, and collectible card booster packs each target a different purchase motivation. The behavioral mechanisms at play include mental accounting — parents frame café spend as 'bonus reward acceleration' rather than pure cost — hyperbolic discounting for same-day booking bonuses, and scarcity for limited-edition items. Well-executed, these systems can lift per-visit revenue by twenty to forty percent with modest operational complexity.
Model 10: Predictive Churn Prevention and Reactivation
The final model uses data science to identify at-risk members and intervene before they cancel. An AI-driven churn prediction score combines declining visit frequency, missed habitual time slots, engagement drops across activities, and sentiment in recent feedback into a single renewal probability index. Members are segmented into stable, watch, and at-risk tiers, and the system triggers context-appropriate interventions for each: gentle engagement nudges for the watch tier, personalized retention offers and manager outreach for the at-risk tier.
Reactivation campaigns extend the same logic to members who have already lapsed. An automated sequence identifies inactive customers, deploys a 'we miss you' message framed around loss aversion ('reclaim the 5,000 points you earned'), offers a special comeback bonus that invokes reciprocity, and invites the family to pick up a surprise reactivation card at the park. Personal outreach from a named staff member — a handwritten note or short phone call — often outperforms any automated offer, especially for high-LTV lapsed members. These interventions typically recover twenty to thirty percent of at-risk or lapsed members at minimal marginal cost.
Personalized Communication and Segmentation
The ten models above generate the raw engagement, but communication is the glue that binds them into a coherent experience for each family. Modern CRM platforms make it straightforward to segment the member base by child age, visit recency, tier, streak status, program participation, and behavioral cluster. Each segment receives messages calibrated to its context: a family of a six-year-old approaching a streak milestone receives different copy than a family of a twelve-year-old who has not visited in six weeks. Generic email blasts train members to ignore the channel; segmented messaging trains them to expect relevance.
Personalization extends beyond segmentation into genuinely one-to-one messaging where possible. The child's name, recent achievement, next mission, and points balance can all be dynamically inserted into communications. Post-visit emails can feature actual photos from the family's most recent visit, not stock imagery. Birthday messages can reference the specific party package the family booked last year. Each of these touches costs nothing incremental once the data pipelines are built, but collectively they signal to the parent that the park treats the family as individuals rather than as entries in a database.
Channel discipline completes the communication stack. Email works well for planned messages, SMS for urgent or time-sensitive notifications, push notifications for in-app engagement, and direct mail for high-value moments such as membership renewal or milestone anniversaries. Each channel has a different cost and attention profile, and a well-designed loyalty program uses them deliberately rather than defaulting to email for everything. The goal is to be present at the right moments without becoming noise in the family's daily life.
Surprise and Delight Strategies
Planned rewards drive expected behavior; surprise rewards drive emotional commitment. Surprise and delight tactics — an unexpected free guest pass given to a long-tenured member, a handwritten birthday card from the general manager, a random 'golden ticket' distributed to a lucky guest on a Tuesday afternoon, a staff member remembering and celebrating a returning child by name — exploit reciprocity and peak-end effects to generate loyalty that engineered programs alone cannot.
The economics of surprise and delight are deceptively favorable. A five-dollar gesture that genuinely touches a family often produces a social media post seen by hundreds of their friends, a word-of-mouth recommendation, or an unplanned return visit. The operator cannot predict which specific gesture will produce which specific outcome, but the aggregate return across many small gestures is consistently high. Budgeting one to two percent of revenue for discretionary surprise-and-delight moments, empowering staff to deploy that budget in real time, and celebrating the best stories internally builds a culture in which magic moments become routine.
The tactic loses power if it becomes predictable. A 'surprise' that arrives every quarter on schedule is no longer a surprise; it is an expected benefit, and members adjust their expectations accordingly. Effective surprise and delight requires variability, both in timing and in form, and a willingness to invest in moments that cannot be measured with typical CRM dashboards. The payoff shows up in long-term retention curves and Net Promoter Scores rather than in short-term conversion rates, which is exactly where sustainable loyalty is built.
VIP Programs and Exclusive Experiences
A small percentage of members — typically the top five to ten percent by spend or tenure — contribute a disproportionate share of revenue and referrals. A dedicated VIP program recognizes and cultivates this cohort with benefits that money alone cannot buy: private openings of new attractions, dinner with the founder or general manager, behind-the-scenes tours of the operations, input into attraction planning, and reserved seating at signature events. These benefits cost the park relatively little and create an emotional relationship that dramatically deepens loyalty among the families who matter most.
Exclusivity must be genuine to work. A 'VIP' program that every member qualifies for is not a VIP program; it is a rebrand. Authentic VIP status requires visible scarcity, clear qualification criteria, and benefits that non-members visibly cannot access. The operator should resist the temptation to expand the tier to hit short-term revenue targets, because the moment VIP access becomes common, its psychological value evaporates. A hundred genuinely treated VIPs are worth more than a thousand diluted ones.
Exclusive experiences also serve as product development inputs. VIP members often provide the most candid and actionable feedback about new attractions, pricing changes, and operational issues, because their emotional investment in the park makes them honest stakeholders rather than transactional customers. Formalizing this feedback through structured advisory sessions, rather than leaving it to chance conversations, turns the VIP tier into a strategic asset that improves the business for every customer over time.
Community Building and Engagement
Loyalty deepens when the relationship extends beyond the park's walls. Member-only events — parents' nights, holiday parties, educational workshops, community service days — give families reasons to gather even when their children are not playing. Over time, these gatherings produce genuine friendships among parents and children, and those friendships become social switching costs that make leaving the park emotionally costly rather than merely financially inconvenient. The operator's role is to create the venues and the reasons; the community then builds itself.
Digital community complements the physical kind. A private Facebook group for members, a dedicated Discord or WhatsApp channel, or a section of the member app for sharing photos and tips gives the community a continuous presence. Staff moderation keeps the tone positive and ensures that questions are answered promptly. User-generated content — tips, photos, and recommendations from members — becomes both social proof for prospective members and a reinforcement loop for existing ones. The best digital communities feel less like a marketing channel and more like an extended family conversation.
Participation in the broader local community amplifies these effects. Sponsoring school events, supporting local charities, and hosting free community days for underserved families signal that the park is a civic institution rather than purely a commercial venue. Members who feel that their spending supports a park with genuine community roots develop a deeper sense of pride in their membership, and the resulting stories generate media coverage and social content that money cannot buy. The virtuous cycle of community engagement, member pride, and organic reputation is one of the most durable competitive advantages available.
Retention Metrics: The Numbers That Matter
Loyalty without measurement is indistinguishable from hope. The core retention metrics every operator should track include repeat visit rate, membership retention rate, churn rate by cohort, visit frequency per member per month, and average membership tenure. Each of these metrics should be measured monthly, reviewed in management meetings, and benchmarked against targets set at the start of the year. A retention rate that drifts downward for three consecutive months is a signal requiring investigation, not a statistic to be filed.
Net Promoter Score — derived from the single question 'how likely are you to recommend this park to a friend?' on a zero-to-ten scale — is the workhorse attitudinal metric. Respondents scoring nine or ten are Promoters, seven or eight are Passives, and zero through six are Detractors. NPS is the difference between the percentage of Promoters and the percentage of Detractors, and it correlates strongly with organic growth and long-term revenue. Parks should target an NPS above fifty for competitive performance, and above seventy for category-leading performance. Tracking NPS monthly and segmenting responses by visit type, tier, and tenure reveals precisely where the guest experience is winning or losing emotional ground.
Deeper attitudinal metrics extend beyond NPS into specific loyalty dimensions. Willingness to pay more, renewal intention, trust and safety perception, perceived developmental value, and perceived uniqueness versus competitors are each measurable through short surveys and provide actionable signal that a single score cannot. Children's attitudinal metrics — 'I want to come back,' excitement rating, emotional recall of peak moments, and willingness to invite friends — should be measured using visual scales and simple language so that young respondents can participate honestly. The resulting dataset reveals not just whether loyalty is strong, but which specific levers to pull when it weakens.
Win-Back Campaigns
Not every member can be retained, and not every lapsed member is unreachable. Structured win-back campaigns recover a meaningful percentage of members who have let their subscriptions lapse or stopped visiting. The process begins with identification: members inactive for thirty, sixty, and ninety days each trigger a different automated sequence. At each stage, the content mix shifts from gentle re-engagement ('we noticed you haven't visited — here's what's new') toward increasingly urgent and valuable comeback offers.
The framing of win-back offers is as important as the offer itself. Loss-aversion language — 'rejoin now to reclaim the 5,000 points you earned' — consistently outperforms generic discount framing, because it speaks to something the member has already invested in rather than inviting them to start from scratch. Personalization further lifts response rates: a win-back message that references the child's name, last activity, and favorite zone signals that the park remembers the family as individuals. Response rates from well-executed win-back sequences typically run between ten and twenty percent, which is an extraordinary return on near-zero marginal cost.
Learning from lapsed members is as valuable as recovering them. A short exit survey, incentivized with a small gift or points credit, asks the simplest and most important question: 'what would have kept you a member?' The responses, aggregated across hundreds of lapsed members, form a precise diagnostic of product and service weaknesses. Operators who treat churn as a feedback channel rather than simply a revenue loss continuously improve the core product, and the improvements reduce future churn in a compounding loop that strengthens the business over time.
Summary Points
✓Loyalty is where the competitive moat of an activity park is ultimately built. well-designed programs raise lifetime value, lower acquisition cost.
✓The dual-stakeholder model requires simultaneously satisfying parents' rational concerns and children's emotional desires. only programs that reinforce both sides produce the self-sustaining 'Ideal Zone'.
✓Behavioral economics , loss aversion, the goal-gradient effect, the peak-end rule, the endowment effect, social proof, scarcity, commitment, reciprocity, framing, present bias.
✓The annual membership with smart scheduling (Model 1) is the anchor program.
✓A points-and-prize economy (Model 2) and a trade card collectible system (Model 3) capture children's long-term engagement through goal-gradient and variable-reward mechanics.
✓Streak programs (Model 4) and birthday-to-member funnels (Model 5) build habitual attendance and convert the richest acquisition surface the park possesses into recurring members.
Operating a single successful park is an achievement; building an enterprise out of that park is a different discipline entirely. Scaling introduces multi-unit management, franchise economics, growth financing, valuation, and eventually exit planning — domains that reward systematic thinking over entrepreneurial improvisation. The founders who thrive in this phase are those who accept that what worked at one location will only work at the second location if it has been documented, codified, and transferred through systems rather than personality. This chapter translates that transition into a practical framework.
The chapter progresses through the natural sequence a growing operator faces. It starts with the signals that indicate readiness to expand, moves through the operational changes required to run multiple units, then examines franchising from both the franchisor and franchisee perspectives. It covers the financing options available at each stage of growth, the drivers of business valuation, and the preparation required to maximize proceeds at exit. Throughout, the focus remains on decisions that preserve or enhance enterprise value rather than those that merely feel like progress.
Long-Term Value Creation: The Strategic Frame
Before contemplating a second location, operators should articulate what the first location is ultimately worth and what drives that value. Enterprise value in family entertainment is a function of recurring revenue quality, EBITDA margin, growth trajectory, defensibility of the brand, and operational transferability. A park that earns two million dollars of EBITDA with stable membership revenue and a documented playbook is worth substantially more per dollar of earnings than an otherwise-identical park with the same EBITDA but dependent entirely on walk-in traffic and the founder's daily presence.
This framing has practical consequences from the earliest days of the business. Every decision — to build recurring revenue rather than rely on admissions, to invest in systems rather than heroic effort, to document procedures rather than keep them tacit, to measure and track everything rather than run on intuition — is ultimately a decision about enterprise value. Operators who internalize this frame make different choices than those who optimize for near-term cash flow, and the cumulative effect is a business that commands premium valuation multiples when it eventually transacts.
The strategic question at each stage of growth, therefore, is not 'how do I earn more money next quarter' but 'how do I increase the value of the enterprise.' These two goals often align but sometimes diverge. Cutting marketing to boost short-term EBITDA may reduce long-term enterprise value if it damages growth trajectory. Opening a second location with insufficient systems may raise revenue but destroy margin and transferability. The scaling and exit chapters that follow should be read through this enterprise-value lens at every decision point.
Indicators of Readiness for a Second Location
The temptation to open a second park arrives early, often before the first is genuinely ready to be replicated. Several objective indicators signal true readiness. The first park should have operated profitably for at least two full years with stable or growing EBITDA margins of twenty percent or more. Membership penetration in the catchment should be approaching saturation, with diminishing returns on local marketing spend. The operational playbook — hiring, training, safety, maintenance, marketing, and finance — should be fully documented and executable by a manager other than the founder.
Financial indicators matter equally. The first park should generate enough free cash flow to partially fund the second without putting the first at risk, or the operator should have established credit relationships and equity partners who can finance growth on reasonable terms. The balance sheet should be strong enough to absorb construction delays, opening losses, and the inevitable surprises of a new market. Operators who expand with marginal finances at the first location and aggressive projections for the second are the ones whose businesses most often fail at the second step.
Market indicators round out the assessment. A viable second location requires a target catchment with demographics, competition, and real estate economics comparable to or better than the first. It requires a plan for marketing launch that does not rely solely on the brand equity of the first location, which may have limited reach in the new market. And it requires a management bench capable of running each park with the same standard of care, which in practice means identifying and training a general manager well before the second location opens. Parks that check all three sets of indicators are the ones that grow successfully; parks that skip any of them typically stall or reverse.
Multi-Unit Management Strategies
Running two parks is not twice as hard as running one; it is four or five times as hard, because coordination, consistency, and communication overhead compound nonlinearly. Successful multi-unit operators invest in centralized systems before opening the second location rather than after. A single venue management platform handling bookings, point-of-sale, memberships, and reporting across all locations from one dashboard is non-negotiable. Centralized marketing, centralized HR, and centralized finance functions ensure brand consistency and operational efficiency without duplicating overhead at each site.
Local adaptation within central systems is the right balance. Brand standards, pricing architecture, safety procedures, and core programming should be consistent everywhere; promotions tied to local school calendars, partnerships with neighborhood organizations, and staffing adjusted to local wage markets should be customized by each park's general manager. The multi-unit operator's job is to distinguish clearly between the elements that must be identical and those that must be local, and to communicate that distinction so unambiguously that every manager internalizes it.
The general manager role becomes the linchpin. A strong general manager at each park executes the playbook, manages local talent, maintains community relationships, and feeds data and insights back to headquarters. Weak general managers become the single biggest source of enterprise value destruction in multi-unit operations, because problems propagate faster than headquarters can detect them. Investment in general manager recruitment, training, compensation, and retention should be disproportionately large relative to other management functions, because the multiplier on getting that role right is larger than on any other role in the business.
Replicating Success and Avoiding Pitfalls
Replication starts with understanding precisely why the first park succeeded. Founders often attribute success to the most visible factors — the attractions, the design, the location — while underestimating less visible factors such as staff culture, community relationships, and the founder's own operational rigor. A systematic post-mortem of the first park, identifying which elements are truly replicable and which were circumstantial, prevents the expensive error of copying surface features while missing the underlying drivers.
Common pitfalls recur across industries. Over-expansion that dilutes management attention and capital, cultural drift as the original team is no longer present at each site, inconsistent guest experience that damages the brand, and financial strain from simultaneous capital expenditures all appear in the obituaries of ambitious operators. The remedy is discipline: a measured expansion pace of roughly one park per year for mid-sized operators, conservative financial planning with explicit downside scenarios, and leadership bandwidth explicitly reserved for the existing locations rather than consumed entirely by the next one.
A seven-mistake checklist from industry practitioners deserves explicit attention. Parks should allocate five to ten percent of annual revenue to capital expenditures to refresh attractions and maintain guest interest, because stale attractions drive churn that no loyalty program can fully offset. They should avoid under-investing in staff training, because front-line staff quality is the single most frequent source of negative reviews. They should plan for capital intensity realistically, set prices dynamically rather than statically, manage reviews proactively, diversify revenue beyond admissions, and treat marketing as an investment rather than an expense. Each mistake is avoidable with intentional planning, and collectively they separate scaling operators from stalling ones.
Franchising as a Growth Vehicle: The Franchisor Perspective
Franchising offers a structured path to rapid expansion by allowing the operator to use other people's capital and local operational expertise in exchange for an upfront fee and ongoing royalties. The U.S. family entertainment center market reached approximately twenty-eight billion dollars in 2023 and is projected to grow to more than seventy billion dollars by 2032, which provides ample headroom for well-positioned franchise concepts. Franchising is not a shortcut, however. It imposes rigorous requirements on the franchisor that directly-owned expansion does not.
A franchise-ready concept requires a fully documented operational playbook — hiring, training, safety, marketing, finance, technology, guest experience, and attraction maintenance — that a qualified franchisee can execute with reasonable support. It requires a Franchise Disclosure Document (FDD), a comprehensive legal instrument describing fees, obligations, litigation history, and financial performance representations, which must be registered and maintained in every jurisdiction where franchises are sold. It requires a support infrastructure capable of onboarding, training, and supporting franchisees at scale, including a real estate selection process, construction supervision, opening support, and ongoing operational coaching.
The financial model of a family entertainment franchise is substantial. Initial franchise fees typically run from fifty thousand to one hundred thousand dollars. Total investment for a mid-to-large concept ranges from approximately two-and-a-half million to more than ten million dollars, covering construction, equipment, and fees. Ongoing royalties are commonly set at six percent of gross sales plus a brand marketing fund contribution of approximately two percent. Established franchises typically reach profitability within eighteen to twenty-four months and achieve profit margins of fifteen to twenty-five percent thereafter. Franchisors, in turn, build a high-margin royalty stream that compounds with each new unit opened.
Buying a Franchise: The Franchisee Perspective
From the franchisee's perspective, buying into an established franchise reduces the uncertainty of starting an independent business at the cost of reduced autonomy and ongoing royalty payments. The trade-off is worth examining carefully. A strong franchise brand provides immediate name recognition, a proven operational playbook, bulk purchasing on equipment and supplies, marketing support, and the accumulated learning of the broader franchise system. These benefits can collapse the time to profitability by a year or more compared to an independent startup.
Brand evaluation before signing is critical. The prospective franchisee should examine the franchisor's existing unit performance, the growth trajectory of the system, the quality and responsiveness of the support infrastructure, and the satisfaction of current franchisees. The FDD's Item 19 financial performance representations, when provided, offer a realistic baseline for revenue and cost expectations, though they should be stress-tested for the specific local market rather than accepted at face value. Visiting several existing franchise locations and speaking candidly with their owners is the single most important piece of due diligence.
Validation is the formal process of this due diligence. A disciplined franchisee will speak with at least ten existing franchisees, review their actual financial statements where possible, visit multiple units at different stages of maturity, and assess whether the operational model actually delivers the returns advertised. Franchisees who skip this step in their excitement to launch a business consistently produce disappointing results, whereas those who complete it thoroughly enter the system with realistic expectations and a strong foundation for success.
Growth Financing Options
Scaling requires capital, and the mix of capital sources changes as the business matures. Retained earnings are the lowest-cost and highest-discipline source of growth capital, because they impose no external obligations and require the business to fund growth out of its own profitability. Operators who can grow from one unit to two or three primarily on retained earnings prove the unit economics of their concept before involving external capital, which later produces better terms when external capital becomes necessary.
Debt financing enters the picture once the business has collateral and a track record. Traditional bank loans, Small Business Administration loans in the United States, and specialist lenders to the attractions industry each have different criteria and cost structures. Debt preserves equity ownership at the cost of fixed payments and restrictive covenants, which constrain operational flexibility. The right level of leverage is a judgment call that depends on cash flow stability, interest rate environment, and the operator's risk tolerance, but many successful multi-unit operators run with debt-to-EBITDA ratios between two and four times as a pragmatic balance.
Equity capital arrives at larger scale, either from family offices, high-net-worth individuals, growth equity funds, or private equity sponsors. Each source has different expectations around growth rate, governance, and exit timing, and the operator should match the source to the stage. Family offices and angels often accept longer horizons and lighter governance. Growth equity funds typically seek three-to-five-year paths to a larger transaction. Private equity sponsors often take control positions and pursue aggressive multi-unit rollout plans. The capital is rarely the scarcest resource; the right partner with aligned incentives is.
Each source comes with non-financial implications that matter as much as the financial ones. Bank debt imposes quarterly reporting and covenant discipline, which most professional operators find useful rather than onerous. Equity partners join the board, bring opinions, and expect governance rigor that many founders find uncomfortable at first. A thoughtful operator decides in advance what operational freedoms are essential and negotiates capital accordingly, rather than accepting whatever terms arrive when cash is running short. Capital raised under duress costs a multiple of capital raised from a position of strength.
Valuation Drivers and EBITDA Multiples
Family entertainment businesses are typically valued on a multiple of EBITDA — Earnings Before Interest, Taxes, Depreciation, and Amortization — which proxies the cash-generating capacity of the operation. Industry multiples generally range from four to eight times EBITDA, with the specific multiple determined by size, growth rate, margin quality, recurring revenue share, geographic diversification, and brand strength. Major public companies in the category have traded in the seven-to-nine-times range, which sets an aspirational ceiling for private operators aiming toward institutional exits.
Several drivers move a specific park's multiple up or down. Recurring membership revenue as a share of total revenue is one of the most important: a park earning half its revenue from memberships and other recurring streams commands a higher multiple than one dependent on one-time admissions. EBITDA margin matters because high-margin businesses convert revenue to cash more efficiently; the top decile of parks achieve margins of thirty percent or more. Growth rate, management depth, documented systems, diversified customer base, and brand recognition each add fractions of a turn to the multiple, and collectively they can be the difference between a five-times-EBITDA outcome and an eight-times outcome on the same earnings.
Translating these drivers into action requires explicit focus on the factors buyers will later price. Operators two to three years from exit should deliberately invest in membership growth, margin expansion through pricing and ancillary spend, management succession beyond the founder, and documentation of every operational process. Each dollar of EBITDA added during this period is worth four to eight dollars at exit, which is among the highest-return investments available anywhere in the business. Owners who understand this arithmetic typically run their final pre-exit years with remarkable discipline, and their proceeds reflect that discipline.
Preparing for Sale: Documentation, Systems, and Growth Story
A business that has been run well is not automatically ready to be sold. Sale readiness is a distinct state characterized by clean documentation, audited financial statements for the most recent two to three years, organized legal contracts, documented operating procedures, a capable management team that can run the business without the founder, and a compelling narrative about future growth that a buyer can credibly adopt. Many otherwise-successful businesses lose one or two turns of multiple at sale simply because they were not properly prepared, and the cost of that under-preparation is measured in millions.
The documentation workstream typically takes six to twelve months. Financial statements should be converted from cash-basis to accrual-basis and audited by a reputable accounting firm. All leases, franchise agreements, vendor contracts, intellectual property registrations, and employment contracts should be organized in a data room ready for buyer diligence. Key operating procedures should be written down. Employee handbooks, safety manuals, and crisis response plans should be current. Any legal or tax issues should be resolved cleanly rather than left to surface during buyer diligence, where they damage both price and deal certainty.
The growth story is the narrative that justifies the buyer's valuation and post-transaction investment thesis. A strong story identifies specific, credible, and achievable growth opportunities: additional locations in adjacent markets, untapped ancillary revenue streams, pricing optimization, loyalty program expansion, or new formats such as corporate events or educational programming. Each opportunity should be supported by data from the existing operations and presented with realistic timelines and economics. Buyers pay for what they believe they can achieve, not for what the seller has already done, so the growth story often determines more of the final price than the historical financial performance.
Buyer Types and Exit Timing
Different buyer types value businesses differently, and the right exit for a given operator depends on personal goals as much as on market conditions. Strategic buyers — larger operators in the same category — typically pay premium multiples when the target fills a geographic or operational gap in their portfolio, because they can extract synergies that financial buyers cannot. Private equity buyers, especially those with existing platform companies in the space, pay competitive multiples and bring capital for further growth but typically seek control and a three-to-seven-year hold period with another sale at the end.
Family offices and high-net-worth individual buyers occupy a middle ground, often accepting lower multiples in exchange for lighter governance and longer hold horizons. Management buyouts, in which the existing team purchases the business with seller financing or private equity backing, preserve culture and institutional knowledge at the cost of lower cash-at-close and longer payment terms. Initial public offerings are available only at very large scale and bring their own burdens; most private family entertainment businesses exit through one of the private transaction types.
Timing matters as much as buyer selection. Market conditions for attractions businesses fluctuate with consumer spending cycles, interest rates, and broader M&A appetite. The ideal exit arrives when the business is showing at least two years of strong growth, the industry is in a favorable cycle, and the founder has built a clear successor team. Exiting during a downturn, immediately after a difficult year, or without a succession plan each reduces proceeds by meaningful amounts. Operators who plan their exit two to three years in advance, choose their window deliberately, and run a competitive process with multiple bidders consistently achieve the best outcomes. A well-prepared sale is the culmination of everything described throughout this handbook: the park becomes not just a destination families love but a valuable enterprise that produces a generational outcome for the people who built it.
Summary Points
✓Enterprise value, not near-term profit, is the correct strategic frame for scaling decisions. every choice should be evaluated against its impact on the eventual.
✓Readiness for a second location requires objective indicators across operations (documented playbook, strong general manager pipeline), finance (profitable base, strong balance sheet).
✓Multi-unit success depends on centralized systems with clearly defined local adaptation. strong general managers at each location are the single most important operational investment.
✓A disciplined replication approach, understanding the real drivers of first-location success, pacing expansion conservatively, and avoiding the seven most common mistakes.
✓Franchising as a franchisor requires a fully documented playbook, an FDD, and a scalable support infrastructure. typical economics include 6% royalties, 2% marketing fees.
✓Buying a franchise trades autonomy for lower startup risk. rigorous validation, at least ten franchisee interviews and multi-site visits.